crinacle's IEM FR measurement database
Nov 9, 2018 at 12:01 PM Post #976 of 1,335
Yeah, the IMM6 is quite the fragile piece of equipment. But if you superglue the capsule part down, I think it can last a pretty dang long time. Case in point:


Mine had been used, abused and gone through hell and back over the course of a year. The input connection is shot and the capsule tip is now in a permanent weird angle, but it still works. But hey, the way I see it it's meant to be a cheap way to measure sound on a phone. I doubt it was built to withstand years worth of use and even more doubtful that it was built to allow the installation of a coupler (hence the casing getting ripped off in all these specific situations).

You could sidegrade to a Veritas for something more durable or a miniDSP EARS for something with a measurements base you can reference against. But if all these are for measurements that you do once in a blue moon then I think it's best to just get another cheap IMM6 (or something similar, its particular design is pretty common) and use it till it breaks.
I just got notified that my mic is being replaced under warranty.
 
Nov 10, 2018 at 12:54 AM Post #978 of 1,335
I'm probably going to get the Dayton to do my measurements. It's cheap. What couplers do you guys find more precise? Anybody try any ear dummies?

You don't need an artificial pinna if you're just doing hobbyist-level IEM measurements. Just get 8mm inner diameter tubing to act as a coupler, though that might be too small for a lot of nozzles so I suggest fitting an additional 10mm inner diameter tube on top of that to accommodate.
 
Nov 16, 2018 at 9:12 AM Post #980 of 1,335
It's been quite a long time, but better late than never. For those who have donated to my GoFundMe all the way back in March (special shoutouts to Head-Fiers @EagleWings and @flinkenick, apologies to the rest whose handles I do not know), I thank you again. You've made the following possible.

May I present to you the prototype concept of a portable, single-channel headphone measuring rig:

B&C 0001 (Version 1)
01b7c6b94e0e560359fa359d8e64e136a402bef3fc.jpg
Built by @WaffleIron with 3D-printed plates, 90-degree folding hinges and the miniDSP EARS silicone blocks with artificial pinnae, so as to accommodate the use of an IEC coupler. Initial designs were drawn up fairly early but there were issues with the 3D printer and the sculpting of the silicone block to specifications, thus the long delay.

headphone portable rig concept 2.png
Original schematics (to scale)
And of course, the fact that it folds allows for compact storage as well as the separation of microphone and headphone stand.

014322b143fe7926ab9c4045eec52b01e7893f83ec.jpg
Fully folded
Here is the first test with the only headphone with me right now, a Sennheiser HD800 with SuperDupont Resonator (raw, 5 placement average per channel, 1/12 octave smoothing):

HD800 SDR.png

As usual, the caveats and disclaimers:
  • The B&C 0001 is still very much a work-in-progress so the creation of a headphone FR database will not be so soon. I would like to have most of the kinks sorted out before I dive into it fully. That said, I will be gathering data from a few headphones in order to see what problems to tackle.
  • Measuring the left channel is possible by swapping to a left ear silicone block.
  • Due to the use of a miniDSP EARS artificial pinna, the 2-5k region will not be accurate to industry standard. I will be attempting to find a clone of some industry-specced ears, but no guarantee about that either.
  • The focus of the rig is still internal comparability. I do not suggest anybody to compare my graphs with others (Tyll, Jude etc.) but rather with other graphs that I create.
  • In the event that a database is created, all measurements will be displayed RAW. Target curves muddy up the data pool and usually determined with industry-specced gear, which mine isn't.
 
Last edited:
Nov 16, 2018 at 10:54 AM Post #981 of 1,335
Sweet rig. Anytime man, but my contribution was quite small. Looking forward to the measurements.

Btw, do you have the original SDRs from sorridge, or is it a DIY foam SDR?
 
Last edited:
Nov 16, 2018 at 11:55 AM Post #983 of 1,335
MEASUREMENT RIG SETUP EXPLAINED IN SIMPLE TERMS

Member XXX from forum YYY and I are presently working on a writeup aiming to streamline the measurement setup with the Room EQ Wizard (REW) software, which we will pass on to the community as a download. Our notes will act as a simple cookbook in support of REW's help index which may be perceived as cumbersome by the novice.

As a start, this is what you need:

1) A computer
2) The REW software (free download: https://www.roomeqwizard.com)
3) A USB microphone OR a calibrated measurement microphone (like this Dayton imm-6)
4) If you don’t have a USB microphone but the second kind (“Dayton”), you need an USB audio adapter such as this one between the mic and the computer’s usb port
5) Female to two male arphone mic audio Y splitter (to connect the mic with the usb audio adapter)
6) An external dac/amp with volume control connected to another of your computer’s usb ports (I use the Schiit Fulla but could also use the Shanling M0, for example)
7) A sound meter like this one

More later. I am presently on the "workflow". With this you cannot only check out the flavour of an earphone, no, you can also QC its channel balance, for example.

ingredients-1.jpg

 
Last edited:
Nov 16, 2018 at 12:27 PM Post #984 of 1,335
Continued from the last post: Setup Workflow

1. Setting Up Preferences

2. Soundcard calibration, step I: calibrating REW’s internal SPL (Sound Pressure Level)

3. Soundcard calibration, step II: calibrating dac/amp and usb audio adapter

And that’s all, folks…always good to get the big picture right away.

The whole thing later...
 
Last edited:
Nov 24, 2018 at 9:14 AM Post #985 of 1,335
An exercise in graph manipulation

There seems to be a worrying trend of audiophiles taking manufacturer's graphs as the absolute truth and dismissing everything else that looks dissimilar as inaccurate. While it may be true that manufacturers are typically the ones with access to highly accurate, industry-standard, multi-kilobuck measurement gear, it is also in their own interests to ensure that whatever data they publish is as "pleasing" to the consumer as possible. While the raw data itself may not be directly modified, there are still many ways to "trick" the reader.

In a way while this may be an educational post, this is also protection against myself in case anyone tries to compare my graphs with the manufacturer's. Just because the measurements are different doesn't mean they're wrong.

There are some ways to make a graph aesthetically pleasing without actually fudging the raw data.
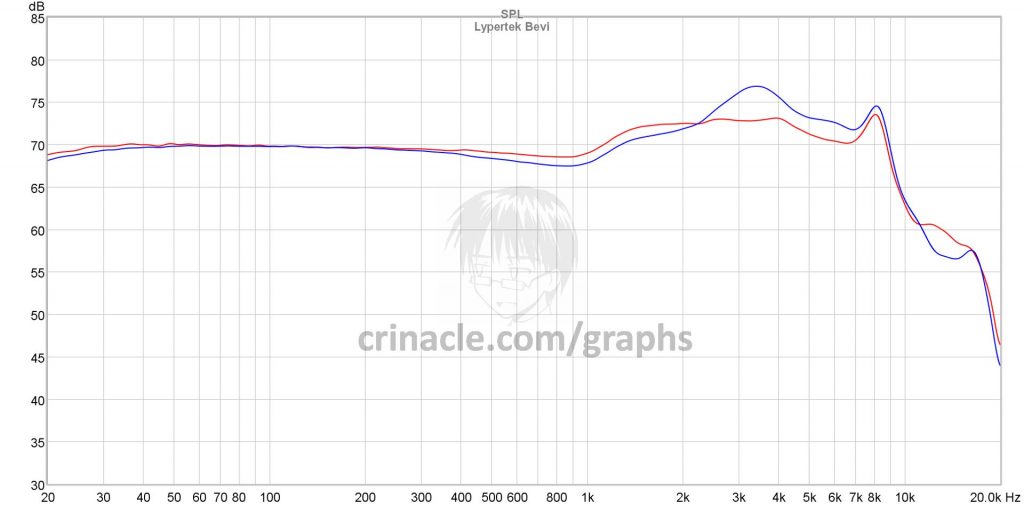
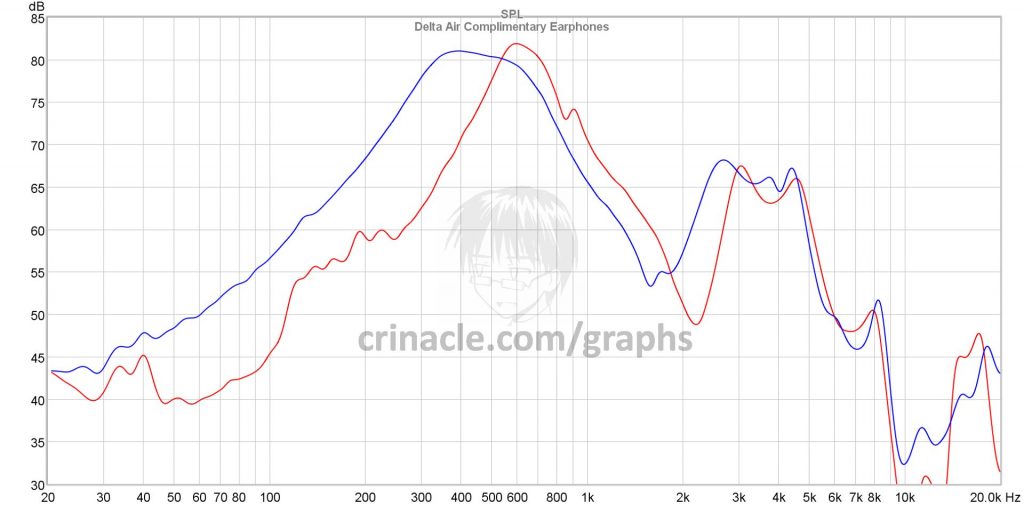
  • Scaling: a lower range acts as a "microscope" and amplifies the peaks and dips of a system. On the flipside, a higher range masks them and can visually "flatten" the imbalances of any given curve.
  • Smoothing: self explanatory. Ideally you would use smoothing to mask noise and artifacts in a measurement, though it can also be used to reduce peaks and dips.
  • Changes to procedure: not following industry-standard procedure can result in graphs that look more visually appealing.
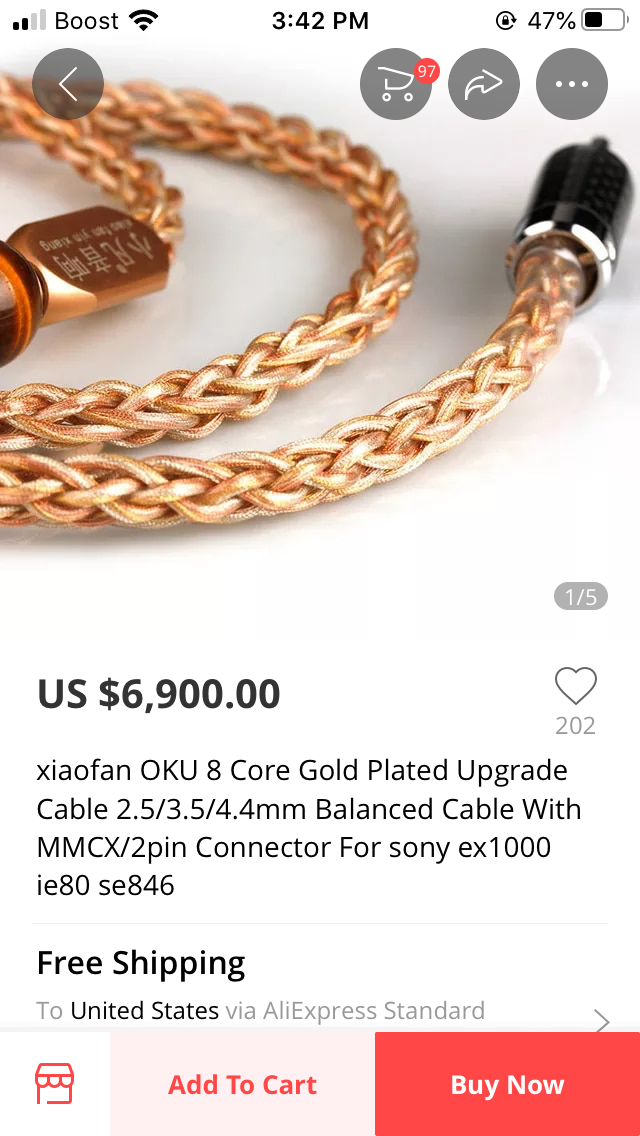
  • Non-standard/uncommon source gear: more in reference to the output impedance of the interface used.
Taking the BGVP DM6 as an example since they seem to be a popular IEM these days (and also because I have one with me right now). Below is what I found on the official store, assumed to be performed on a standard IEC60318-4 system (and posted various times around the forum to show how "flat" it is):

BGVP_DM6_FR_Graph.PNG
And here is mine based off my own rig (also IEC60318-4) and procedures that I follow with every measurement I perform:

DM6.png
Smoothed at 1/12 octave
So why is my graph different from the manufacturer's? Is my setup wrong, or is their setup wrong? The reality is that both of our data can be "truthful" and yet be displayed differently; I can get a near-identical graph to what the manufacturer provided if I simply reverse-engineer their settings and procedures (most of which they have thankfully provided). What I've determined is the following:
  • Scaling: Blow up the y-axis to 100dB as opposed to my usual of 55dB.
  • Smoothing: 1/6 octave smoothing as opposed to my usual of 1/12 (or raw, depending)
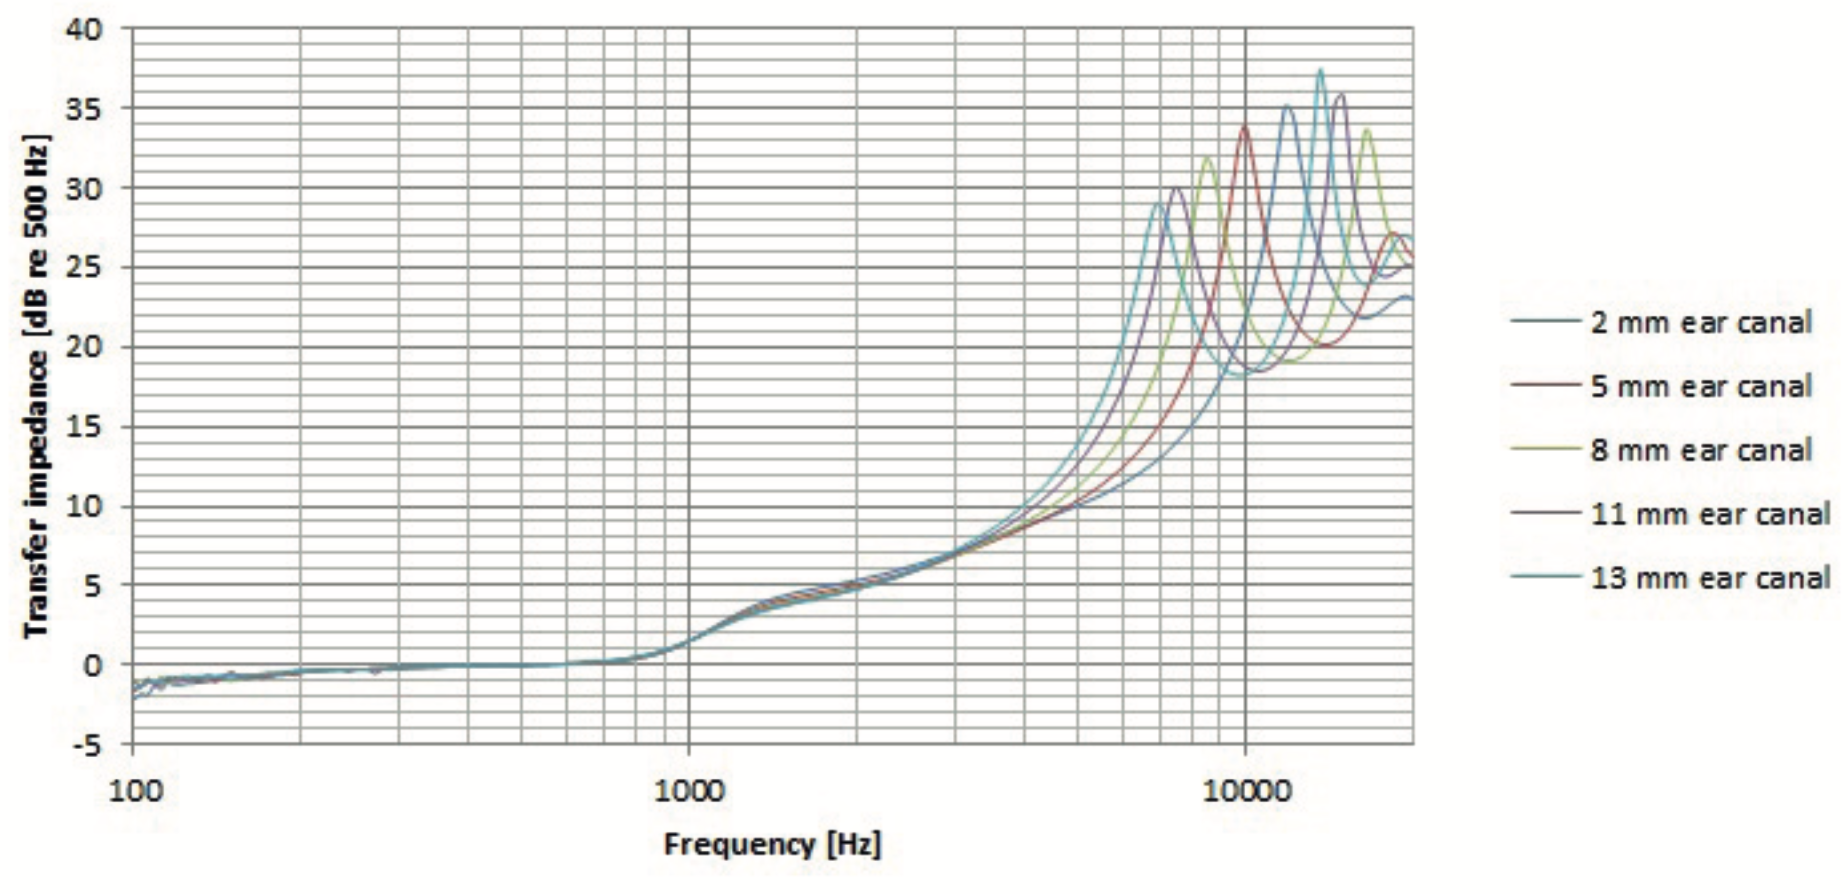
  • Procedure: Remove the external ear simulator from the IEC coupler and measure at reference plane instead (using the procedure highlighted in section 6.2 of IEC60318-4, usually meant for custom earphones only)
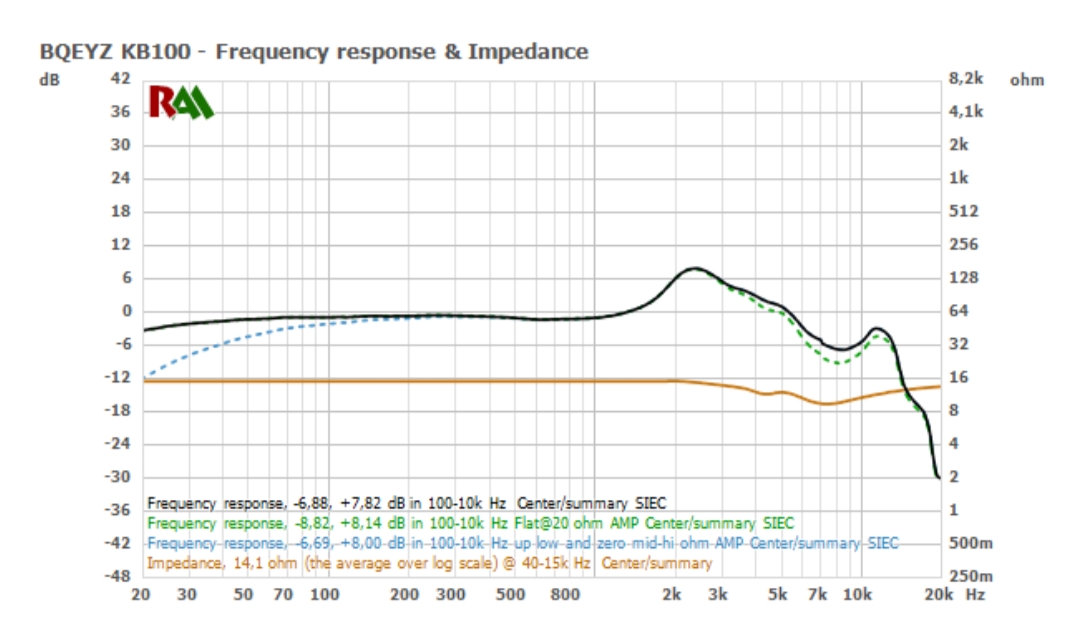
  • Output impedance: attach a 20ohm resistor in series to the earphone in an attempt to match the 33ohm output impedance of the interface used by the manufacturer (which is crazy high, most DAPs and amplifiers are below 5ohms)
The final result matches the manufacturer's graph almost to a T:

DM6 manipulated.png
To reiterate my point again, just because two graphs are different doesn't necessarily mean that one has to be wrong while the other has to be right. Just like with reviews and impressions, don't just take data from a single source; seek out as many as you can before forming an opinion.
 

Attachments

  • DM6 moremani.png
    DM6 moremani.png
    133.8 KB · Views: 0
Last edited:
Nov 24, 2018 at 10:57 AM Post #986 of 1,335
Stretching out the vertical axis is a common thing I see manufacturers do. The way I see it, manufacturers will do what they need to do to sell units. It's up to us to figure out what those axes are. What disturbs me more is that many of them QC/development test their IEMs on similar axes, putting their testing acumen in question.
 
Nov 24, 2018 at 2:59 PM Post #988 of 1,335
On the one hand, it's better than pure marketingese as a description of the sound signature. Also on the one hand, it's not really more useful than pure marketingese as a description of the sound signature.
DEEP. VISCERAL. BASS.
CRYSTALLINE>CLARITY.
HIGH! (INCREDIBLY^)RESOLUTION
"EMOTIONALLY COMPLICATED TONAL NUANCE"
 
Last edited:
Nov 24, 2018 at 7:26 PM Post #990 of 1,335
On the one hand, it's better than pure marketingese as a description of the sound signature. On the one hand, it's not really more useful than pure marketingese as a description of the sound signature.
DEEP. VISCERAL. BASS.
CRYSTALLINE>CLARITY.
HIGH! (INCREDIBLY^)RESOLUTION
"EMOTIONALLY COMPLICATED TONAL NUANCE"

My favorite is Fever!
 

Users who are viewing this thread

Back
Top