


- Joined
- Jun 4, 2014
- Posts
- 3,652
- Likes
- 2,923
This thread documents my ongoing journey toward improving DIY home-audio measurements in the hope that it will encourage others to do the same. This is about trying to make the best-quality measurements that you can at home, on a headfi budget. (Ok, some headfiers spend $3500 on IEMs like the Tia Forte, but... most of what you need can be found for less than a few hundred dollars, and you can make quite a lot of progress for less than $100.) Several previous headfi posts have already covered the subject of measurements, but have covered either very cheap and potentially-not-as-accurate options:
https://www.head-fi.org/showcase/vibro-labs-veritas.21034/
https://www.head-fi.org/threads/vib...r-iems-like-a-pro-with-amateur-budget.777533/
https://www.head-fi.org/threads/minidsp-ha-dsp-discussion-and-impressions.860281/
https://www.head-fi.org/threads/fos...d-measurements.618659/#user_DIYMeasurementKit
https://www.head-fi.org/threads/cri...base-315-entries.830062/page-53#post-14193230
or super-accurate measurements that require spending the GDP of a small country:
https://www.head-fi.org/threads/headphone-measurements-different-setups-different-results.751100/
To measure quantities like frequency response of in-ear monitors, you don't need ultra-realistic dummy heads or anechoic chambers, but measuring harmonic distortion and noise can get a bit more challenging. The purpose of this post is to try to match, as closely as possible, the quality of professional-level in-ear simulators and audio analyzers using a budget that doesn't require you to remortgage your house.
Acknowledgements
The only reason I was able to create this post (or any measurements at all) was through the generosity of other headfi members who were willing to share their time and wisdom. A huge thanks to @ThomasHK, @crinacle, @jude from Headfi, John Mulcahy from roomeqwizard.com, Morten Wille from GRAS and Julian Bunn (author of Android's AudioTool) for their patience with all my noobish stupidity. Also, a big shout-out to @castleofargh for this awesome and inspiring post:
https://www.head-fi.org/threads/hea...different-results.751100/page-2#post-13933374.
I can't not mention InnerFidelity, whose fantastic (but incomplete) collection of headphone measurements got me started on this topic:
https://www.innerfidelity.com/headphone-measurements
Many props to @crinacle who (to the best of my knowledge) maintains the largest collection of DIY measurements on headfi:
https://www.head-fi.org/threads/crinacles-iem-fr-measurement-database-315-entries.830062/
I also want to give kudos to another fantastic (but also incomplete) website that has some really great tools to allow you to compare data such as frequency response (FR), total harmonic distortion (THD), specs, photos and more, from those headphones in its measurement database:
https://www.rtings.com/headphones/tools/compare
There's also a project I became aware of recently that attempts to rate equipment via a single scalar measure (a "music-based df-metric"):
http://soundexpert.org/portable-players-beta
Of course it's overly-simplistic to boil everything about a device down into one single number, but that's something our brains have already done in deciding which is our favorite headphone. It's interesting research to see if an algorithm get figure this out too, and our hearing probably shares enough common traits that some aspects of what constitutes good audio can be seen directly from measurements.
Why Do Measurements at Home?
Most OEMs don't release measurements of their new products. To some extent I sympathize with these OEMs. Measurements - at any level of sophistication - are always uncertain and will never perfectly match what any given individual would hear. A potential buyer could be put off by an inaccurate measurement. Since no headphone, DAC, amp, DAP, etc., is perfect in every regard, potential buyers could also be put off by an accurate measurement, where a competitor or troll could simply focus on - and amplify - one legitimate weakness and the placebo effect of that expensive new product could be suddenly destroyed.
It's therefore no surprise that buying audio equipment sight-unseen (or hearing-unheard?!) is very common. It's usually difficult for potential buyers to demo new products, and often the first indication they have that they don't really like the sound of the product comes after listening to it at home and realizing they're now on the hook for a shipping and restocking fee (if they're even able to return it at all). It shouldn't be this way. Seeing, understanding and comparing parameters like amplitude and THD+N as a function of frequency can often give a very good indication of whether a particular product will work for you, or may be an improvement over something you already own. That's not to say this process is foolproof; measurements, and their interpretations, are fraught with difficulties and there are risks of false negatives and false positives. But we ought to try. And, in my experience, we can do a pretty good and consistent job at home these days, as long as we're careful.
Depending on what you want to do, there are some things you're going to need. Note - you won't need all of the items listed - the various combinations of hardware and software are discussed in the spoiler links below:
A Few of My Favorite Things
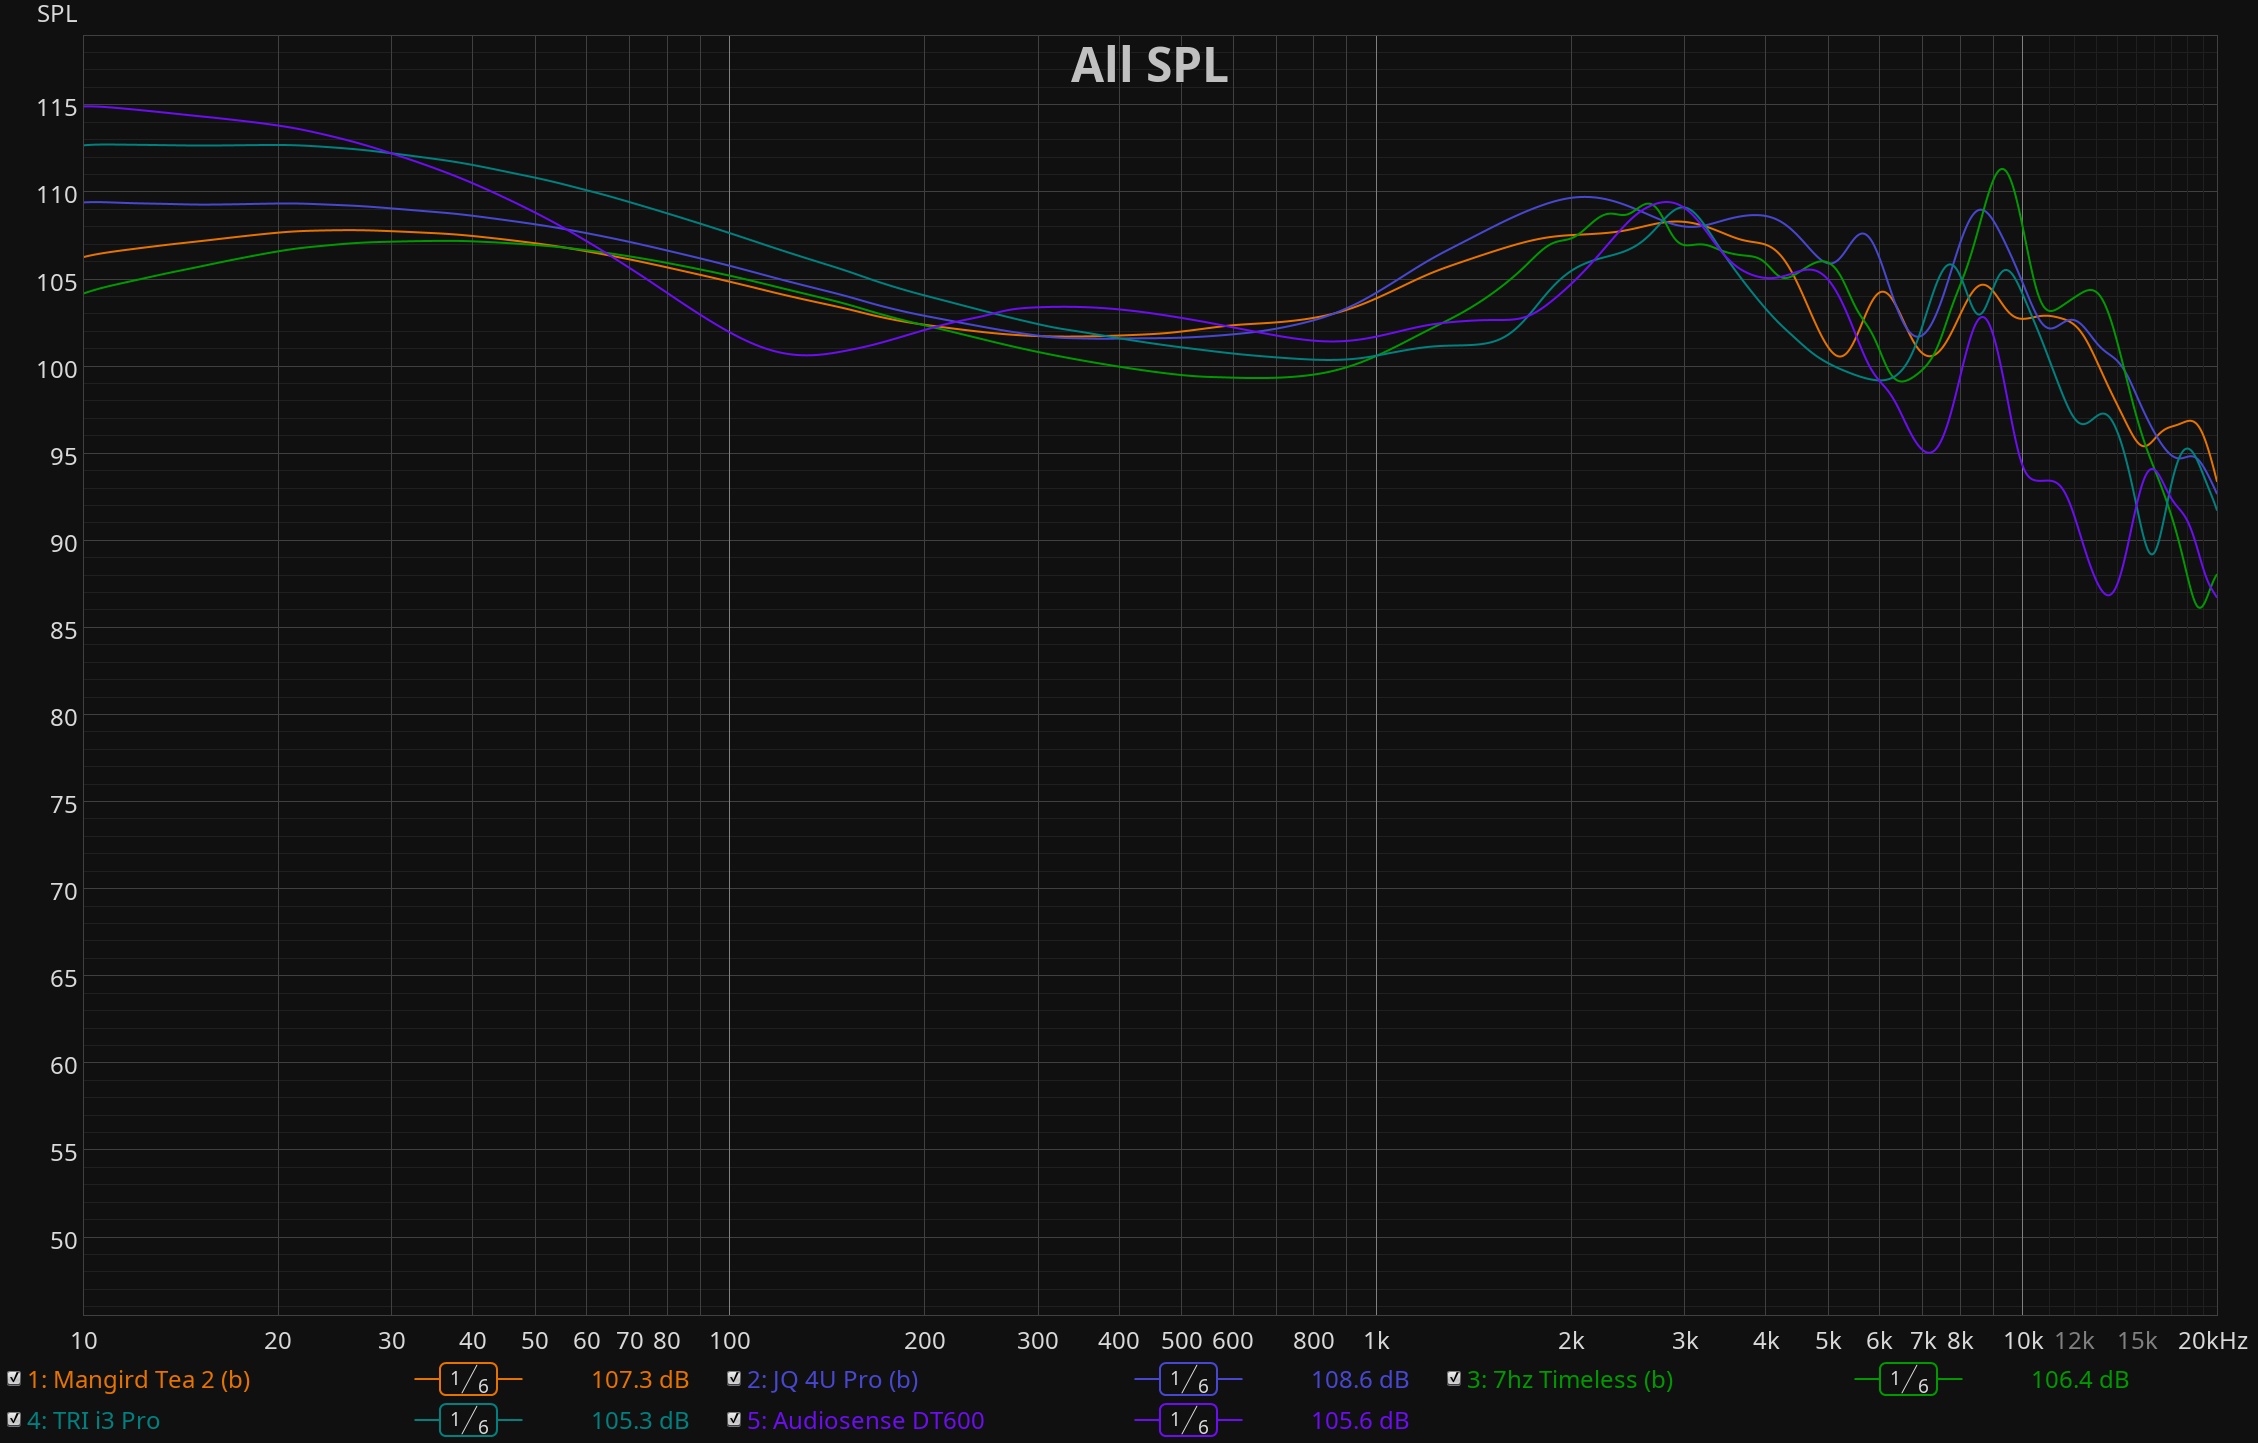
I don't have the time, the energy or the will to create the sort of enormous database that @crinacle has put together on headfi, but I wanted to include a few plots here of a select number of headphones that I think are worthy of consideration. A kind of mini wall of fame, if you like") These are all great headphones - I'm not sure there's a right or wrong with respect to frequency responses here, as it just comes down to individual hearing and preferences.
These are all great headphones - I'm not sure there's a right or wrong with respect to frequency responses here, as it just comes down to individual hearing and preferences.

Stepped-sine THD measurements were again made at 80 dB SPL with 3 points per octave (output normalized w.r.t. the fundamental):

Surprisingly, the Xelento measures with the lowest THD of any of these IEMs - lower even than that of the KSE1500. The consistent rise in THD at lower volumes with all IEMs may be because I tend to like eartips that provide a very good seal - sometimes better than that intended by the OEM (I like my sub-bass!) At some point I will revisit this measurement rig to make sure it's adequately damped from vibrations.
Parting Thoughts
As I said at the top, this is a journey. I hope this is helpful for those starting out with their own measurements. Criticisms, suggestions, flame wars, etc., are all welcome - especially with alternative or improved suggestions on hardware, software or measuring techniques. I will try to update this post if I get any further information on good hardware or software options down the road.
https://www.head-fi.org/showcase/vibro-labs-veritas.21034/
https://www.head-fi.org/threads/vib...r-iems-like-a-pro-with-amateur-budget.777533/
https://www.head-fi.org/threads/minidsp-ha-dsp-discussion-and-impressions.860281/
https://www.head-fi.org/threads/fos...d-measurements.618659/#user_DIYMeasurementKit
https://www.head-fi.org/threads/cri...base-315-entries.830062/page-53#post-14193230
or super-accurate measurements that require spending the GDP of a small country:
https://www.head-fi.org/threads/headphone-measurements-different-setups-different-results.751100/
To measure quantities like frequency response of in-ear monitors, you don't need ultra-realistic dummy heads or anechoic chambers, but measuring harmonic distortion and noise can get a bit more challenging. The purpose of this post is to try to match, as closely as possible, the quality of professional-level in-ear simulators and audio analyzers using a budget that doesn't require you to remortgage your house.
Acknowledgements
The only reason I was able to create this post (or any measurements at all) was through the generosity of other headfi members who were willing to share their time and wisdom. A huge thanks to @ThomasHK, @crinacle, @jude from Headfi, John Mulcahy from roomeqwizard.com, Morten Wille from GRAS and Julian Bunn (author of Android's AudioTool) for their patience with all my noobish stupidity. Also, a big shout-out to @castleofargh for this awesome and inspiring post:
https://www.head-fi.org/threads/hea...different-results.751100/page-2#post-13933374.
I can't not mention InnerFidelity, whose fantastic (but incomplete) collection of headphone measurements got me started on this topic:
https://www.innerfidelity.com/headphone-measurements
Many props to @crinacle who (to the best of my knowledge) maintains the largest collection of DIY measurements on headfi:
https://www.head-fi.org/threads/crinacles-iem-fr-measurement-database-315-entries.830062/
I also want to give kudos to another fantastic (but also incomplete) website that has some really great tools to allow you to compare data such as frequency response (FR), total harmonic distortion (THD), specs, photos and more, from those headphones in its measurement database:
https://www.rtings.com/headphones/tools/compare
There's also a project I became aware of recently that attempts to rate equipment via a single scalar measure (a "music-based df-metric"):
http://soundexpert.org/portable-players-beta
Of course it's overly-simplistic to boil everything about a device down into one single number, but that's something our brains have already done in deciding which is our favorite headphone. It's interesting research to see if an algorithm get figure this out too, and our hearing probably shares enough common traits that some aspects of what constitutes good audio can be seen directly from measurements.
Why Do Measurements at Home?
Most OEMs don't release measurements of their new products. To some extent I sympathize with these OEMs. Measurements - at any level of sophistication - are always uncertain and will never perfectly match what any given individual would hear. A potential buyer could be put off by an inaccurate measurement. Since no headphone, DAC, amp, DAP, etc., is perfect in every regard, potential buyers could also be put off by an accurate measurement, where a competitor or troll could simply focus on - and amplify - one legitimate weakness and the placebo effect of that expensive new product could be suddenly destroyed.
It's therefore no surprise that buying audio equipment sight-unseen (or hearing-unheard?!) is very common. It's usually difficult for potential buyers to demo new products, and often the first indication they have that they don't really like the sound of the product comes after listening to it at home and realizing they're now on the hook for a shipping and restocking fee (if they're even able to return it at all). It shouldn't be this way. Seeing, understanding and comparing parameters like amplitude and THD+N as a function of frequency can often give a very good indication of whether a particular product will work for you, or may be an improvement over something you already own. That's not to say this process is foolproof; measurements, and their interpretations, are fraught with difficulties and there are risks of false negatives and false positives. But we ought to try. And, in my experience, we can do a pretty good and consistent job at home these days, as long as we're careful.
Depending on what you want to do, there are some things you're going to need. Note - you won't need all of the items listed - the various combinations of hardware and software are discussed in the spoiler links below:
You're going to need at least some of the following:
An Android device with a mic input. (Ideally via a 3.5 mm socket.)
An iOS device with a 3.5 mm mic input (Again, ideally an older iOS device with a 3.5 mm socket. My experience with the dongle is that its analog input involves both high- and low-pass filters that you can't disable.)
A computer with a USB input (I don't recommend using internal sound cards).
Clio Pocket from Audiomatica (thanks to @DanWiggins for this recommendation!): THD+N 0.008%, Z-out 150 Ohm.
RME ADI-2 Pro USB ADC/DAC: 120 dB dynamic range, THD: 0.00022 %, THD+N : -110.6 dB, 0.00029 %, 120 dBA S/N, Z-out: 0.1 Ohms.
RME Babyface Pro: 113 dB SNR (unweighted), 116 dBA, THD: < 0.00032 % (< -110 dB), THD+N: < 0.00063 % (<-104 dB), THD @ 30 dB Gain: < -107 dB, < 0.0004 %, THD+N @ 30 dB Gain: < -100 dB, < 0.001 %, Channel separation: > 110 dB, 3.5mm Jack z-out = 2 Ohm. OUTPUT!: THD: 0.0005% (-106 dB), THD+N: 0.0008% (-102 dB), Channel separation: > 110 dB
Focusrite Forte USB ADC/DAC:
THD+N 0.0007%, 20Hz-20 kHz, 117 dBA S/N (mic in), 0.003%, 20Hz-20kHz, 116 dBA (line in), Z-out: <8 Ohms.
Rode VXLR Plus XLR to 3.5mm female TRS mic adapter.
StarTech ICUSBAUDIO2D external USB sound card.
3.5 mm TRRS male to 3.5 mm TRS female splitter.
Coupler
In any measurement rig, some kind of coupler is needed to connect the in-ear monitor to the mic and to mimic the acoustic load and impedance response of the human ear. Over the years there have been various attempts at developing a practical ear simulator coupler standard, which eventually led to the International Electrotechnical Commission (IEC) 60318 standard. Also known as a 711 coupler, this became an IEC standard in 1981 for measurements up to 10 kHz.
Professional 711 couplers range in price from around $4000 (from GRAS or Bruel and Kjaer), to about $1700 (from Larson Davis). All these couplers come with BNC-connected pre-polarized condenser mics that require a pre-amp; in other words, you can't just plug them into your standard USB sound card. However, any coupler that follows the same standard should result in the same measurements and there are more affordable options:

To show how these perform, here are raw measurement comparisons from each coupler on Shure's KSE1500 at 85 dB using Shure medium olive eartips:

One addendum here - I can't take credit for the miniDSP EARS measurements as I don't own a miniDSP EARS. These measurements came from a friend of mine who's in the trade and needs to remain anonymous, as they don't want to be seen publishing measurements from competitor companies. I'm not allowed to say who it is, but they know who they are, and I'm grateful for their contributions. Thanks buddy Here's some validation of that second measurement rig - a comparison of our (flat, no EQ) KSE1500 measurements using medium Shure olive tips at 85 dB:

Considering the inevitable differences in air pressure, humidity, 711 coupler and headphone unit variations, insertion depths, etc., that occur on opposite sides of the Atlantic - the agreement here is pretty encouraging. My friend (Coupler X) has some spikes in his measurements that look to be AC interference, but ignoring those, we're clearly measuring the same headphone model.
Summary of the Various Coupler Performances
The simple tube couplers miss the resonance and impedance subtleties of sealed/vented vs non-sealed IEMs, and although a single compensation curve won't perfectly correct this to match results from a 711 coupler in all situations, almost any type of coupler, including an old piece of garden hose, would seem to suffice for making relative comparisons of one IEM against another. The bigger issue is arguably the poor-quality mics on some of these couplers (like Veritas and miniDSP EARS) which tend to roll off in the lows and/or highs. In addition, the compensation curves that are supplied with the miniDSP EARS appear to be fairly odd. EARS comes with two sets of compensation curves - one for diffuse-field compensation and the other for "raw" measurements (which are presumably to account for the sound-card and mic):

The raw-compensation curves are relatively flat, but the diffuse-field compensation curves add a giant boost to the high frequencies in addition to removing the usual mid-range resonance bump. If that high-frequency correction is necessary for this mic, why doesn't it also appear in the "raw" compensation curves? To me, the miniDSP EARS doesn't appear good value for money, at least not for raw measurements of IEMs. (The much cheaper steel tube coupler needs far less compensation and comes quite close to the 711 coupler results.)
Vibro Veritas ($79):
https://diyearphone.com/products/veritas-ii
miniDSP EARS ($199):
https://www.minidsp.com/products/acoustic-measurement/ears-headphone-jig
Steel tube coupler ($29):
https://item.taobao.com/item.htm?spm=a1z09.2.0.0.289c2e8dyh5pF7&id=543766653085&_u=63rk7cgh8cb4
711 coupler alone - for assembly with condenser mic ($59 - mic costs extra):
https://item.taobao.com/item.htm?spm=a1z09.2.0.0.289c2e8dyh5pF7&id=37135316408&_u=63rk7cgh0386
711 coupler + dynamic mic - as used by @crinacle - ($83):
https://item.taobao.com/item.htm?spm=a1z09.2.0.0.289c2e8dyh5pF7&id=37135316408&_u=63rk7cgh0386
711 coupler + plinth + dynamic mic ($126):
https://item.taobao.com/item.htm?spm=a1z09.2.0.0.289c2e8dyh5pF7&id=41416109881&_u=63rk7cgh12f3
Many thanks to @earfonia, who found the same seller with the same products on AliExpress:
https://www.aliexpress.com/item/4000073069259.html?spm=a2g0s.9042311.0.0.27424c4di1SuPh
I have found that these 711 couplers with a pre-polarized condenser capsule mic gives significantly lower THD+N than those with the dynamic/electret mics. My favorite mic is the Earthworks M50, but the Sonarworks XREF20 is also a good (and cheaper) option. These have (what's claimed to be) a perfectly flat frequency response from 20 Hz to 20 kHz. In reality, each unit actually comes with its own unique calibration curve which does make some small corrections. In order to use this coupler with a separate condenser mic, you can't just shove it into the coupler. That might be what it looks like in the figure, but it's not.
What you need to do is to remove the protective top cap of the condenser mic (the Sonarworks, Dayton EMM-6 and Behringer ECM8000 mics all just have weakly glued-on cover caps), then carefully pry the capsule mic from the metal enclosure and epoxy-glue it flush to the end of the threaded coupler insert, which should then be sealed up with ptfe tape on the thread. It is important to create a seal without creating any new cavities inside the coupler. (BTW, it's also really important NOT to use ptfe tape on the outer ear-canal shank thread. More on this later...) The M50 and XREF20 mics requires 48V phantom power which must be supplied externally for the RME ADI-2 Pro, or can be supplied directly from a Focusrite Forte or Babyface Pro (the Focusrite Forte need its power supply attached for this). The same phantom power can also be stepped-down to power standard 3.5 mm dynamic mics using the Rode VXLR+. There are many other devices you can find that will supply phantom power to condenser mics and provide USB interfaces and that claim to have clean pre-amps (e.g., Behringer Xenyx 302USB), but in my experience it's rare to find something with published THD+N, and if you can't see its specs, I recommend you don't trust it, at least not for the purposes of THD+N measurements. In this regard, given its low THD+N, line-inputs, mic (including phantom-powered) inputs, the Focusrite Forte is an awesome piece of kit for measuring IEMs. It is discontinued now, but can be found second-hand for around $200 in the US.
An Android device with a mic input. (Ideally via a 3.5 mm socket.)
An iOS device with a 3.5 mm mic input (Again, ideally an older iOS device with a 3.5 mm socket. My experience with the dongle is that its analog input involves both high- and low-pass filters that you can't disable.)
A computer with a USB input (I don't recommend using internal sound cards).
Clio Pocket from Audiomatica (thanks to @DanWiggins for this recommendation!): THD+N 0.008%, Z-out 150 Ohm.
RME ADI-2 Pro USB ADC/DAC: 120 dB dynamic range, THD: 0.00022 %, THD+N : -110.6 dB, 0.00029 %, 120 dBA S/N, Z-out: 0.1 Ohms.
RME Babyface Pro: 113 dB SNR (unweighted), 116 dBA, THD: < 0.00032 % (< -110 dB), THD+N: < 0.00063 % (<-104 dB), THD @ 30 dB Gain: < -107 dB, < 0.0004 %, THD+N @ 30 dB Gain: < -100 dB, < 0.001 %, Channel separation: > 110 dB, 3.5mm Jack z-out = 2 Ohm. OUTPUT!: THD: 0.0005% (-106 dB), THD+N: 0.0008% (-102 dB), Channel separation: > 110 dB
Focusrite Forte USB ADC/DAC:
THD+N 0.0007%, 20Hz-20 kHz, 117 dBA S/N (mic in), 0.003%, 20Hz-20kHz, 116 dBA (line in), Z-out: <8 Ohms.
Rode VXLR Plus XLR to 3.5mm female TRS mic adapter.
StarTech ICUSBAUDIO2D external USB sound card.
3.5 mm TRRS male to 3.5 mm TRS female splitter.
Coupler
In any measurement rig, some kind of coupler is needed to connect the in-ear monitor to the mic and to mimic the acoustic load and impedance response of the human ear. Over the years there have been various attempts at developing a practical ear simulator coupler standard, which eventually led to the International Electrotechnical Commission (IEC) 60318 standard. Also known as a 711 coupler, this became an IEC standard in 1981 for measurements up to 10 kHz.
Professional 711 couplers range in price from around $4000 (from GRAS or Bruel and Kjaer), to about $1700 (from Larson Davis). All these couplers come with BNC-connected pre-polarized condenser mics that require a pre-amp; in other words, you can't just plug them into your standard USB sound card. However, any coupler that follows the same standard should result in the same measurements and there are more affordable options:
To show how these perform, here are raw measurement comparisons from each coupler on Shure's KSE1500 at 85 dB using Shure medium olive eartips:
One addendum here - I can't take credit for the miniDSP EARS measurements as I don't own a miniDSP EARS. These measurements came from a friend of mine who's in the trade and needs to remain anonymous, as they don't want to be seen publishing measurements from competitor companies. I'm not allowed to say who it is, but they know who they are, and I'm grateful for their contributions. Thanks buddy
Here's some validation of that second measurement rig - a comparison of our (flat, no EQ) KSE1500 measurements using medium Shure olive tips at 85 dB:
Considering the inevitable differences in air pressure, humidity, 711 coupler and headphone unit variations, insertion depths, etc., that occur on opposite sides of the Atlantic - the agreement here is pretty encouraging. My friend (Coupler X) has some spikes in his measurements that look to be AC interference, but ignoring those, we're clearly measuring the same headphone model.
Summary of the Various Coupler Performances
The simple tube couplers miss the resonance and impedance subtleties of sealed/vented vs non-sealed IEMs, and although a single compensation curve won't perfectly correct this to match results from a 711 coupler in all situations, almost any type of coupler, including an old piece of garden hose, would seem to suffice for making relative comparisons of one IEM against another. The bigger issue is arguably the poor-quality mics on some of these couplers (like Veritas and miniDSP EARS) which tend to roll off in the lows and/or highs. In addition, the compensation curves that are supplied with the miniDSP EARS appear to be fairly odd. EARS comes with two sets of compensation curves - one for diffuse-field compensation and the other for "raw" measurements (which are presumably to account for the sound-card and mic):
The raw-compensation curves are relatively flat, but the diffuse-field compensation curves add a giant boost to the high frequencies in addition to removing the usual mid-range resonance bump. If that high-frequency correction is necessary for this mic, why doesn't it also appear in the "raw" compensation curves? To me, the miniDSP EARS doesn't appear good value for money, at least not for raw measurements of IEMs. (The much cheaper steel tube coupler needs far less compensation and comes quite close to the 711 coupler results.)
Vibro Veritas ($79):
https://diyearphone.com/products/veritas-ii
miniDSP EARS ($199):
https://www.minidsp.com/products/acoustic-measurement/ears-headphone-jig
Steel tube coupler ($29):
https://item.taobao.com/item.htm?spm=a1z09.2.0.0.289c2e8dyh5pF7&id=543766653085&_u=63rk7cgh8cb4
711 coupler alone - for assembly with condenser mic ($59 - mic costs extra):
https://item.taobao.com/item.htm?spm=a1z09.2.0.0.289c2e8dyh5pF7&id=37135316408&_u=63rk7cgh0386
711 coupler + dynamic mic - as used by @crinacle - ($83):
https://item.taobao.com/item.htm?spm=a1z09.2.0.0.289c2e8dyh5pF7&id=37135316408&_u=63rk7cgh0386
711 coupler + plinth + dynamic mic ($126):
https://item.taobao.com/item.htm?spm=a1z09.2.0.0.289c2e8dyh5pF7&id=41416109881&_u=63rk7cgh12f3
Many thanks to @earfonia, who found the same seller with the same products on AliExpress:
https://www.aliexpress.com/item/4000073069259.html?spm=a2g0s.9042311.0.0.27424c4di1SuPh
I have found that these 711 couplers with a pre-polarized condenser capsule mic gives significantly lower THD+N than those with the dynamic/electret mics. My favorite mic is the Earthworks M50, but the Sonarworks XREF20 is also a good (and cheaper) option. These have (what's claimed to be) a perfectly flat frequency response from 20 Hz to 20 kHz. In reality, each unit actually comes with its own unique calibration curve which does make some small corrections. In order to use this coupler with a separate condenser mic, you can't just shove it into the coupler. That might be what it looks like in the figure, but it's not.
What you need to do is to remove the protective top cap of the condenser mic (the Sonarworks, Dayton EMM-6 and Behringer ECM8000 mics all just have weakly glued-on cover caps), then carefully pry the capsule mic from the metal enclosure and epoxy-glue it flush to the end of the threaded coupler insert, which should then be sealed up with ptfe tape on the thread. It is important to create a seal without creating any new cavities inside the coupler. (BTW, it's also really important NOT to use ptfe tape on the outer ear-canal shank thread. More on this later...) The M50 and XREF20 mics requires 48V phantom power which must be supplied externally for the RME ADI-2 Pro, or can be supplied directly from a Focusrite Forte or Babyface Pro (the Focusrite Forte need its power supply attached for this). The same phantom power can also be stepped-down to power standard 3.5 mm dynamic mics using the Rode VXLR+. There are many other devices you can find that will supply phantom power to condenser mics and provide USB interfaces and that claim to have clean pre-amps (e.g., Behringer Xenyx 302USB), but in my experience it's rare to find something with published THD+N, and if you can't see its specs, I recommend you don't trust it, at least not for the purposes of THD+N measurements. In this regard, given its low THD+N, line-inputs, mic (including phantom-powered) inputs, the Focusrite Forte is an awesome piece of kit for measuring IEMs. It is discontinued now, but can be found second-hand for around $200 in the US.
There are several popular software tools that are cheap, or even free:
REW: https://www.roomeqwizard.com/
ARTA: http://www.artalabs.hr/
AudioTool (Android) : https://play.google.com/store/apps/details?id=com.julian.apps.AudioTool&hl=en_US
AudioTools (iOS) : https://itunes.apple.com/us/app/audiotools/id325307477?mt=8r
FFT Plot (iOS): https://itunes.apple.com/us/app/fft-plot-real-time-sound-frequency-analyzer/id569468015?mt=8
Any of these will work for producing frequency-response curves, but they work a little differently and the accuracy can vary a bit. The last three options are all real-time analysis (RTA) tools for smartphones/tablets that are designed to show noise spectra in real time, as it's recording. FFT Plot (iOS) and AudioTool (Android) can both be fed with white-noise test tracks and a frequency-response curve generated by (sliding-)averages of the FFTs over a sufficiently-long period of time. FFT Plot seems quite fast and accurate, but does not have any way of exporting its measurement data files. Android's AudioTool app (not the same app or developer as that of the iOS AudioTools app!) has more features and allows export of ASCII data files, but doesn't allow very large FFT samples and has limited options to compute sliding averages, which results in a somewhat bumpy output. AudioTool (for Android) is also not very accurate in the low frequencies, with a significant roll-off below about 50 Hz which isn't easy to calibrate or compensate for. You can by-pass your phone's ADC with a dongle, and even connect a StarTech USB sound card via an OTG connector:

In my experience, these dongley options were much less accurate than using the internal ADC of my LG V30. In particular, Google's USB-C-to-3.5mm dongle gives nasty roll-offs in both the lows and highs. (These dongles are also temperamental to use and tend to fire pop-ups from various apps that might want to take over the DAC, or perform data transfers, etc. I don't relish the day when we're all forced to use dongles because there are no more TRRS sockets. IMHO, losing the 3.5 mm socket is a significant step backward in every regard other than that of Tim Cook's bank balance.)
The AudioTools app for iOS is, IMHO, the best of the three apps, but it has a few bugs in it. It also outputs SPL integrated over octave bands, which means to see a flat response, you actually need to feed it pink noise (equal power per octave), rather than white noise (equal power at all frequencies). I've found it necessary to follow these steps carefully each time you use it:
1) Open the AudioTools app
2) Connect the mic
3) Go to settings->settings and calibration->Microphone setup
4) Click on the "i" to the right (information)
5) Select "Calibration File"
6) Select "Default" and then dismiss the popup
7) Select the mic calibration file you actually want (in my case, a file called zero.txt - many thanks to @crinacle for his tip on applying this null mic-calibration file)
8) Click "Apply" and then dismiss the popup again
9) Say done on both panels
10 Click Acoustics->FFT
11) Measure
I typically feed the headphone or device under test (DUT) the pink-noise signal from my QP1R and use the iOS device only to measure. I believe @crinacle is using a TRRS splitter, so that the iOS device also drives its own test signal. That's clever in terms of portability, but I've chosen not to go that route because I'd like to limit any potential issues from a slightly less reliable audio source, and don't mind also carrying around my QP1R. I recommend using your best-quality, lowest-output-impedance audio source to feed the white (or pink) noise test track to your headphones. Uncompensated (using a null calibration file full of zeros), the iOS AudioTools FFT app gives very accurate FR results via its RTA using a 90% overlap for the FFT sliding averages. The Android AudioTool app doesn't allow as long FFT samples or overlaps, so its FR curve is a bit more wobbly. It also needs some compensation in the low-frequency end. Google's USB-C dongle is a disaster, with roll-offs in the lows and highs. The example below is a FR measurement from Etymotic's ER4XR:

These smartphone apps will work directly with any 3.5 mm dynamic mic, such as that in the Veritas or dynamic mic 711-couplers, but they do need a splitter or TRRS-to-TRS mic adapter - you cannot plug them directly into the phone's 3.5 mm socket, because they don't come with TRRS plugs. I have not yet tried to use a condenser mic with a smartphone app, but that's not a high priority because I don't know a way of capturing THD measurements via a smartphone app, and for FR, the dynamic mics are perfectly adequate. All these smartphone apps are available at a fairly minimal cost.
REW and ARTA can't be run on a smartphone - they need to run on a PC or Mac. They use a more accurate approach to computing frequency response, which is to play a logarithmic frequency sweep through the computer's digital-output and record the transfer function from the sound card input. This can generate more information than just frequency response - phase data also provides information on the impulse response (something that would be difficult to measure from an actual Dirac delta function input). REW and ARTA also allow the measurement of total harmonic distortion and noise (something that can't be done by RTA smartphone apps recording white or pink noise). ARTA has a nominal cost; REW is free, but the author accepts donations.
The Clio pocket (http://www.audiomatica.com/wp/?page_id=2429) was a suggestion from @DanWiggins that can be used for both FR and THD+N and could be a good option for anybody that doesn't already use REW or ARTA, since it includes all necessary hardware and software. (Data files can be exported to REW or ARTA.) It comes with its own mic, but not a coupler. I've not yet tried this device, because my RME and Focusrite devices already offer lower THD+N, but this could be a great almost-all-in-one portable solution for anybody starting out.
REW: https://www.roomeqwizard.com/
ARTA: http://www.artalabs.hr/
AudioTool (Android) : https://play.google.com/store/apps/details?id=com.julian.apps.AudioTool&hl=en_US
AudioTools (iOS) : https://itunes.apple.com/us/app/audiotools/id325307477?mt=8r
FFT Plot (iOS): https://itunes.apple.com/us/app/fft-plot-real-time-sound-frequency-analyzer/id569468015?mt=8
Any of these will work for producing frequency-response curves, but they work a little differently and the accuracy can vary a bit. The last three options are all real-time analysis (RTA) tools for smartphones/tablets that are designed to show noise spectra in real time, as it's recording. FFT Plot (iOS) and AudioTool (Android) can both be fed with white-noise test tracks and a frequency-response curve generated by (sliding-)averages of the FFTs over a sufficiently-long period of time. FFT Plot seems quite fast and accurate, but does not have any way of exporting its measurement data files. Android's AudioTool app (not the same app or developer as that of the iOS AudioTools app!) has more features and allows export of ASCII data files, but doesn't allow very large FFT samples and has limited options to compute sliding averages, which results in a somewhat bumpy output. AudioTool (for Android) is also not very accurate in the low frequencies, with a significant roll-off below about 50 Hz which isn't easy to calibrate or compensate for. You can by-pass your phone's ADC with a dongle, and even connect a StarTech USB sound card via an OTG connector:

In my experience, these dongley options were much less accurate than using the internal ADC of my LG V30. In particular, Google's USB-C-to-3.5mm dongle gives nasty roll-offs in both the lows and highs. (These dongles are also temperamental to use and tend to fire pop-ups from various apps that might want to take over the DAC, or perform data transfers, etc. I don't relish the day when we're all forced to use dongles because there are no more TRRS sockets. IMHO, losing the 3.5 mm socket is a significant step backward in every regard other than that of Tim Cook's bank balance.)
The AudioTools app for iOS is, IMHO, the best of the three apps, but it has a few bugs in it. It also outputs SPL integrated over octave bands, which means to see a flat response, you actually need to feed it pink noise (equal power per octave), rather than white noise (equal power at all frequencies). I've found it necessary to follow these steps carefully each time you use it:
1) Open the AudioTools app
2) Connect the mic
3) Go to settings->settings and calibration->Microphone setup
4) Click on the "i" to the right (information)
5) Select "Calibration File"
6) Select "Default" and then dismiss the popup
7) Select the mic calibration file you actually want (in my case, a file called zero.txt - many thanks to @crinacle for his tip on applying this null mic-calibration file)
8) Click "Apply" and then dismiss the popup again
9) Say done on both panels
10 Click Acoustics->FFT
11) Measure
I typically feed the headphone or device under test (DUT) the pink-noise signal from my QP1R and use the iOS device only to measure. I believe @crinacle is using a TRRS splitter, so that the iOS device also drives its own test signal. That's clever in terms of portability, but I've chosen not to go that route because I'd like to limit any potential issues from a slightly less reliable audio source, and don't mind also carrying around my QP1R. I recommend using your best-quality, lowest-output-impedance audio source to feed the white (or pink) noise test track to your headphones. Uncompensated (using a null calibration file full of zeros), the iOS AudioTools FFT app gives very accurate FR results via its RTA using a 90% overlap for the FFT sliding averages. The Android AudioTool app doesn't allow as long FFT samples or overlaps, so its FR curve is a bit more wobbly. It also needs some compensation in the low-frequency end. Google's USB-C dongle is a disaster, with roll-offs in the lows and highs. The example below is a FR measurement from Etymotic's ER4XR:
These smartphone apps will work directly with any 3.5 mm dynamic mic, such as that in the Veritas or dynamic mic 711-couplers, but they do need a splitter or TRRS-to-TRS mic adapter - you cannot plug them directly into the phone's 3.5 mm socket, because they don't come with TRRS plugs. I have not yet tried to use a condenser mic with a smartphone app, but that's not a high priority because I don't know a way of capturing THD measurements via a smartphone app, and for FR, the dynamic mics are perfectly adequate. All these smartphone apps are available at a fairly minimal cost.
REW and ARTA can't be run on a smartphone - they need to run on a PC or Mac. They use a more accurate approach to computing frequency response, which is to play a logarithmic frequency sweep through the computer's digital-output and record the transfer function from the sound card input. This can generate more information than just frequency response - phase data also provides information on the impulse response (something that would be difficult to measure from an actual Dirac delta function input). REW and ARTA also allow the measurement of total harmonic distortion and noise (something that can't be done by RTA smartphone apps recording white or pink noise). ARTA has a nominal cost; REW is free, but the author accepts donations.
The Clio pocket (http://www.audiomatica.com/wp/?page_id=2429) was a suggestion from @DanWiggins that can be used for both FR and THD+N and could be a good option for anybody that doesn't already use REW or ARTA, since it includes all necessary hardware and software. (Data files can be exported to REW or ARTA.) It comes with its own mic, but not a coupler. I've not yet tried this device, because my RME and Focusrite devices already offer lower THD+N, but this could be a great almost-all-in-one portable solution for anybody starting out.
So, you've made a frequency-response measurement - congrats! Now, how are you going to present it? This still seems to be an unsettled question, with some people preferring to present raw data, corrected only for deficiencies in the mic, amp and ADC, and others preferring to present data "compensated" for the effects of the human anatomy. There's a lot of confusion out there about compensation curves. I've always put disclaimers and explanations on all measurements I've presented on headfi, but I've found out the hard way that most people don't bother to read the fine print. I would never want to be responsible for giving a falsely negative impression via my measurements, as there's a very high probability that what you see in ANY measurement is not what you'd actually hear. One of my measurements had the dubious privilege of appearing in a recent talk given by @jude at RMAF (dubious by virtue of being about how measurements can go badly wrong):
The relevant comments (at ~28:00) concerned measurements of the Xelento: "nice IEM, but not so nice in this measurement... and the ER4XR doesn't look like this either..." A poster on the Xelento forums used this graph as ammunition to label the Xelento as "intrinsically flawed", which is a perfect example of an utterly false negative. IMHO, the Xelento is one of the very best headphones you can purchase right now. A few more points on this:
1) You should always read the fine print. These were older measurements made using a Vibro Veritas 1 coupler (which is not 711-compliant), they were diffuse-field compensated, measured with non-standard eartips, and they also included loopback compensations for the (not-so-great-quality) StarTech sound card and corrections for the coupler mic. The fine-print stated that these wouldn't match absolute levels. They are, however, IMHO, still perfectly useful for making relative comparisons.
2) There are many reasons why these Xelento measurements may have discrepancies with those of headfi's measurement rig (many thanks to @jude for spending an entire afternoon pointing out most of them to me!). The most obvious differences are in data presentation (compensated vs raw measurements), eartips (SpinFit vs stock Xelento tips), a simple 3D-printed plastic tube vs an actual 711-coupler, and damping in headfi's new "hi-res" coupler (more on this later). However, again, IMHO it's still ok to use this cheaper rig for relative measurements.
3) The logic in using diffuse-field compensation (DFC) was to mimic what InnerFidelity were doing. At the time (and this still may be true), InnerFidelity had the largest on-line database of headphone FR measurements anywhere, and they were/are all presented with a DF compensation. To the best of my knowledge, InnerFidelity have not yet measured the Xelento, but they did recently measure the ER4XR:
https://www.innerfidelity.com/images/EtymoticER4XR.pdf
Now, it may not look nice, but actually the above Veritas DFC measurements are actually very similar to those from InnerFidelity. Below is the original un-smoothed ER4XR Veritas measurement compared with InnerFidelity's measurements. The differences aren't much larger than the differences between the L and R buds measured at InnerFidelity (and Etymotic have a notoriously tight tolerance for their L & R pairings):

There is a great article from InnerFidelity that explains the logic behind using diffuse-field compensation curves:
https://www.innerfidelity.com/content/new-compensation-curve-innerfidelity-measurements
Briefly, the argument goes like this... When you put a single microphone in free air and measure white noise (or a flat/neutral frequency sweep), you get a flat measurement. But when you play the same sound to a dummy head with microphones in its ear canals, the geometry of the head, pinnae and ear canal create a response which has a little bump in the low end (mainly from the geometry of the head), and a more significant bump around 3-4 kHz from ear canal resonance. The argument is that this is what a flat FR actually looks like to our brains, and therefore one should subtract out the effects from the shape of the head and ears in order to see the actual underlying shape of the virtual "source" spectra. Allegedly, humans prefer a flat response played from speakers. On the other hand, human preferences are very difficult to measure or gauge with any kind of precision, and our brains can compensate for all sorts of skewed inputs (example: https://www.theguardian.com/education/2012/nov/12/improbable-research-seeing-upside-down).
Arguably, IEMs are the one type of headphone where you definitely do bypass all of the head and outer ear and (at least in the case of Etymotic IEMs) a good chunk of the inner ear too. Humans definitely do have an increased sensitivity around 4 kHz as a result of those ear canal resonances:

The point from the above graph is not the obvious rises at the frequency extremes, but the little dip (at all SPLs) around 3-4 kHz. So, if you want to have something that is flat at the eardrum, the input signal should really have had a dip at ~4 kHz to begin with. In other words, flat isn't actually flat at our eardrums and can only be flat at our brains via some form of internal, biological, DSP. My current thinking is that flat-at-our-eardrums is what we should be shooting for.
The other problem with compensation is that there's no agreed-upon standard. Using different compensation curves on different measurement rigs significantly reduces the probability of us making meaningful comparisons across rigs. These are the reasons why I'm (mostly) going away from using the diffuse-field compensation that InnerFidelity uses. I'm still producing the odd measurement on my old Vibro Veritas coupler with DF compensation, simply because I want to compare against a legacy of data I have from that coupler, but I'm making most newer measurements without any compensation curves applied (other than those calibrations for the mic and sound card).
The relevant comments (at ~28:00) concerned measurements of the Xelento: "nice IEM, but not so nice in this measurement... and the ER4XR doesn't look like this either..." A poster on the Xelento forums used this graph as ammunition to label the Xelento as "intrinsically flawed", which is a perfect example of an utterly false negative. IMHO, the Xelento is one of the very best headphones you can purchase right now. A few more points on this:
1) You should always read the fine print. These were older measurements made using a Vibro Veritas 1 coupler (which is not 711-compliant), they were diffuse-field compensated, measured with non-standard eartips, and they also included loopback compensations for the (not-so-great-quality) StarTech sound card and corrections for the coupler mic. The fine-print stated that these wouldn't match absolute levels. They are, however, IMHO, still perfectly useful for making relative comparisons.
2) There are many reasons why these Xelento measurements may have discrepancies with those of headfi's measurement rig (many thanks to @jude for spending an entire afternoon pointing out most of them to me!). The most obvious differences are in data presentation (compensated vs raw measurements), eartips (SpinFit vs stock Xelento tips), a simple 3D-printed plastic tube vs an actual 711-coupler, and damping in headfi's new "hi-res" coupler (more on this later). However, again, IMHO it's still ok to use this cheaper rig for relative measurements.
3) The logic in using diffuse-field compensation (DFC) was to mimic what InnerFidelity were doing. At the time (and this still may be true), InnerFidelity had the largest on-line database of headphone FR measurements anywhere, and they were/are all presented with a DF compensation. To the best of my knowledge, InnerFidelity have not yet measured the Xelento, but they did recently measure the ER4XR:
https://www.innerfidelity.com/images/EtymoticER4XR.pdf
Now, it may not look nice, but actually the above Veritas DFC measurements are actually very similar to those from InnerFidelity. Below is the original un-smoothed ER4XR Veritas measurement compared with InnerFidelity's measurements. The differences aren't much larger than the differences between the L and R buds measured at InnerFidelity (and Etymotic have a notoriously tight tolerance for their L & R pairings):
There is a great article from InnerFidelity that explains the logic behind using diffuse-field compensation curves:
https://www.innerfidelity.com/content/new-compensation-curve-innerfidelity-measurements
Briefly, the argument goes like this... When you put a single microphone in free air and measure white noise (or a flat/neutral frequency sweep), you get a flat measurement. But when you play the same sound to a dummy head with microphones in its ear canals, the geometry of the head, pinnae and ear canal create a response which has a little bump in the low end (mainly from the geometry of the head), and a more significant bump around 3-4 kHz from ear canal resonance. The argument is that this is what a flat FR actually looks like to our brains, and therefore one should subtract out the effects from the shape of the head and ears in order to see the actual underlying shape of the virtual "source" spectra. Allegedly, humans prefer a flat response played from speakers. On the other hand, human preferences are very difficult to measure or gauge with any kind of precision, and our brains can compensate for all sorts of skewed inputs (example: https://www.theguardian.com/education/2012/nov/12/improbable-research-seeing-upside-down).
Arguably, IEMs are the one type of headphone where you definitely do bypass all of the head and outer ear and (at least in the case of Etymotic IEMs) a good chunk of the inner ear too. Humans definitely do have an increased sensitivity around 4 kHz as a result of those ear canal resonances:
The point from the above graph is not the obvious rises at the frequency extremes, but the little dip (at all SPLs) around 3-4 kHz. So, if you want to have something that is flat at the eardrum, the input signal should really have had a dip at ~4 kHz to begin with. In other words, flat isn't actually flat at our eardrums and can only be flat at our brains via some form of internal, biological, DSP. My current thinking is that flat-at-our-eardrums is what we should be shooting for.
The other problem with compensation is that there's no agreed-upon standard. Using different compensation curves on different measurement rigs significantly reduces the probability of us making meaningful comparisons across rigs. These are the reasons why I'm (mostly) going away from using the diffuse-field compensation that InnerFidelity uses. I'm still producing the odd measurement on my old Vibro Veritas coupler with DF compensation, simply because I want to compare against a legacy of data I have from that coupler, but I'm making most newer measurements without any compensation curves applied (other than those calibrations for the mic and sound card).
In my experience, most IEMs isolate reasonably well. That's the whole point of an IEM (or should be). For this reason, it generally isn't necessary to make your measurements in an anechoic chamber on a deserted mountaintop. I can be in a room with a decent amount of noise, and get the exact same FR from those measured in a dead-silent environment. (THD+N is another story though - more on this later...) However, there are some things that can go wrong, or cause measurement results that aren't repeatable and it's worth mentioning some of the more obvious problems:
1) Electrical devices nearby - turn them all off. It's not so much the noise they generate, but many of the cheaper measurement devices can show a glitch or bump around 60 Hz (alternating current mains frequency).
2) Eartips. IEMs often come with a selection of various foam and/or silicone eartips. Eartips make a huge difference, so you need to specify what was used, and if you're trying to match somebody else's results (or repeat your own), you must make sure to use the exact same eartips. Foam tips are the easiest to measure with (for reasons discussed below), but significantly damp the higher frequencies compared to silicone, so if you aren't listening with foam tips, you probably don't want to see measurements made with foam tips. You will typically want to measure the exact device (including eartips) that you're going to be listening to. Bear in mind, some odd-shaped eartips or custom shells won't easily fit into a round coupler. I know some people will make an argument for anthropomorphic pinnae and concha bowls, but there's a problem here too. You'll know if you can't get a good fit with a particular eartip in your own ears, but your anthropomorphic dummy head won't be able to tell you.
If you're going to measure with foam tips, be consistent with how you prepare and roll the tips. The common practice of "preparing" foam tips (squashing the end down before rolling the tip) can make a significant difference to the treble. See this post as an example: https://www.head-fi.org/threads/se846-filter-mod.802350/page-13#post-14954447
3) Sealing in the coupler - when inserting silicone-tipped IEMs into certain couplers, you might want to count 30s before measuring... The internal workings of the coupler are generally something you shouldn't mess with. These are designed as an entity, so everything inside, including the mic and its connection to the coupler, plays a role in determining its overall acoustic impedance. A well-sealed coupler creates a situation where the air between the coupler mic and driver from a non-front-venting IEM can get pressurized when inserting an IEM with a silicone eartip, and this can artificially elevate the low-frequency response. The effect is real of course, and the elevated air pressure is what can cause driver flex from your IEMs, but that effect is usually temporary and not a normal listening situation. Air pressure will eventually equilibrate (often users will open their jaws to equalize the pressure via the eustachian tube), but it helps to get there by not using a totally air-tight coupler->ear canal seal (a metal thread seal without ptfe is all you want here) and/or waiting about 30 seconds before measuring. You won't have this problem with all couplers and you won't have this problem with foam tips, because foam tips are rolled and only expand to fill the ear canal after having been inserted.
4) Insertion of the tip into the coupler: Make sure it's consistent from measurement to measurement. A deeper insertion implies a shorter distance from driver to microphone, and hence a higher resonant frequency. Resonance peaks will shift with insertion depth, so be consistent and insert the IEM the same way, to the same depth each time - or as close as you can. Some variation in results are to be expected, so don't worry too much. This is a real phenomenon. People that read these graphs should be made to understand that this shift is a real phenomenon and there will be some uncertainty and variation from individual to individual.
5) Anchoring the IEM. This step usually isn't necessary with foam tips, because foam tips hold the IEM and damp any vibrations from the IEM itself (but foam tips have their own issues - see point 2 above). So, typically, you just can roll the foam tip, insert into the coupler, allow the foam to expand fully, and then measure. Silicone tips, however, can allow the IEM to wobble on the end of the stem of the eartip, and this usually creates glitches in the FR at the resonant mode(s) of vibration of the combined IEM/tip structure. These are difficult to circumvent completely. Even if the eartip were to fit perfectly in an anthropomorphic dummy ear canal, if the IEM itself were free to wobble, even slightly in the dummy concha bowl, you might see these effects. (It looks like even @jude's Xelento measurement shows this issue at around 160 Hz: https://www.head-fi.org/threads/beyerdynamic-xelento.827372/page-78#post-14480482). My recommendation with silicone tips is always to anchor the IEM with mounting putty or blu-tack, while being careful not to block any vent ports on the IEM.
Unless you're on a near-lethal dose of Xanax, holding the IEM steady in the coupler with your hands while measuring won't work at all - you'll see all sorts of nasty artifacts in the measurements. Silicone-tipped IEMs must be anchored with mounting putty and then left well alone while measuring. For example, the Zero Audio Carbo Tenore is a tiny IEM which is held easily in the coupler by its own eartip:

But since that's a silicone eartip, it's time for mounting putty, being careful not to block the vent port:

For any odd-shaped eartips, mounting putty is also essential, because cylindrical or conical couplers need round eartips in order to form a proper seal.
Most of my measurements have been made with various SpinFit tips, because that's what I use most of the time and they're round and fit easily in my ears and my couplers. Foam would be an easier option for measurements, but unless I need maximum isolation, I tend to prefer the sound from Cp240, Cp800 or Cp100 SpinFits and so measurements with those specific eartips are more useful to me. This is why I used SpinFit Cp100 tips on the measurements in my review of the Xelento (https://www.head-fi.org/showcase/be...ile-devices.22337/reviews?order=likes#reviews).
So the choice of eartip and the method you use to create a seal for them are crucial. Always report what eartip was used when making a measurement, because FR differences between eartips will likely be significant.
6) Use a consistent (medium) sound-pressure level for all measurements: With headphones driven at very low volume levels, there's a greater risk of pollution from external noise or increased THD+N from the extra gain needed in the microphone pre-amp; at very large SPLs, there's a small risk of shifting the FR. While the frequency response of most headphones isn't all that sensitive to modest changes in SPL, many show small deviations at large dB levels and some show significant variations:
Xelento - Identical FR at all SPLs:

ER4XR - some small variations at larger SPLs:

SE846 - modest variations at larger SPLs:

KSE1500 - significant shifts in FR at larger SPLs:

I don't know whether the KSE1500 FR variation with SPL is another happy accident or intentional design. (Arguably, there's less need for U- or V-shaped sound signatures at very high volumes.) This doesn't affect me in practice, since I never listen to the KSE1500 above about volume level 13 - not even for very special occasions like Symphony X's "The Odyssey" But for those that like to push the envelope and risk their hearing, there's a chance you're damping that treble peak as you raise the volume. Not necessarily a problem, IMHO, just a curiosity of this IEM. For those without a SPL meter, if you set the KSE1500 line-in to maximum green, these are the FR variations with volume level:

These last measurements were made with a (corrected/compensated) Vibro Veritas coupler and StarTech sound card, but they perfectly match the effect seen with the RME ADI-2 Pro/Focusrite Forte and 711 couplers.
So, to ensure consistent, repeatable measurements, there appears to be sweet spot in a range of roughly 85-95 dB, within which we can minimize measurement errors and still have a frequency response that doesn't visibly shift.
7) Use a source with a very low output-impedance. I've recommended devices like the Focusrite Forte here as an input device. You do not want to use the Forte as an output device to drive your headphones. This post explains why: https://www.head-fi.org/threads/audio-measurements-on-a-headfi-budget.893084/page-2#post-14956334
1) Electrical devices nearby - turn them all off. It's not so much the noise they generate, but many of the cheaper measurement devices can show a glitch or bump around 60 Hz (alternating current mains frequency).
2) Eartips. IEMs often come with a selection of various foam and/or silicone eartips. Eartips make a huge difference, so you need to specify what was used, and if you're trying to match somebody else's results (or repeat your own), you must make sure to use the exact same eartips. Foam tips are the easiest to measure with (for reasons discussed below), but significantly damp the higher frequencies compared to silicone, so if you aren't listening with foam tips, you probably don't want to see measurements made with foam tips. You will typically want to measure the exact device (including eartips) that you're going to be listening to. Bear in mind, some odd-shaped eartips or custom shells won't easily fit into a round coupler. I know some people will make an argument for anthropomorphic pinnae and concha bowls, but there's a problem here too. You'll know if you can't get a good fit with a particular eartip in your own ears, but your anthropomorphic dummy head won't be able to tell you.
If you're going to measure with foam tips, be consistent with how you prepare and roll the tips. The common practice of "preparing" foam tips (squashing the end down before rolling the tip) can make a significant difference to the treble. See this post as an example: https://www.head-fi.org/threads/se846-filter-mod.802350/page-13#post-14954447
3) Sealing in the coupler - when inserting silicone-tipped IEMs into certain couplers, you might want to count 30s before measuring... The internal workings of the coupler are generally something you shouldn't mess with. These are designed as an entity, so everything inside, including the mic and its connection to the coupler, plays a role in determining its overall acoustic impedance. A well-sealed coupler creates a situation where the air between the coupler mic and driver from a non-front-venting IEM can get pressurized when inserting an IEM with a silicone eartip, and this can artificially elevate the low-frequency response. The effect is real of course, and the elevated air pressure is what can cause driver flex from your IEMs, but that effect is usually temporary and not a normal listening situation. Air pressure will eventually equilibrate (often users will open their jaws to equalize the pressure via the eustachian tube), but it helps to get there by not using a totally air-tight coupler->ear canal seal (a metal thread seal without ptfe is all you want here) and/or waiting about 30 seconds before measuring. You won't have this problem with all couplers and you won't have this problem with foam tips, because foam tips are rolled and only expand to fill the ear canal after having been inserted.
4) Insertion of the tip into the coupler: Make sure it's consistent from measurement to measurement. A deeper insertion implies a shorter distance from driver to microphone, and hence a higher resonant frequency. Resonance peaks will shift with insertion depth, so be consistent and insert the IEM the same way, to the same depth each time - or as close as you can. Some variation in results are to be expected, so don't worry too much. This is a real phenomenon. People that read these graphs should be made to understand that this shift is a real phenomenon and there will be some uncertainty and variation from individual to individual.
5) Anchoring the IEM. This step usually isn't necessary with foam tips, because foam tips hold the IEM and damp any vibrations from the IEM itself (but foam tips have their own issues - see point 2 above). So, typically, you just can roll the foam tip, insert into the coupler, allow the foam to expand fully, and then measure. Silicone tips, however, can allow the IEM to wobble on the end of the stem of the eartip, and this usually creates glitches in the FR at the resonant mode(s) of vibration of the combined IEM/tip structure. These are difficult to circumvent completely. Even if the eartip were to fit perfectly in an anthropomorphic dummy ear canal, if the IEM itself were free to wobble, even slightly in the dummy concha bowl, you might see these effects. (It looks like even @jude's Xelento measurement shows this issue at around 160 Hz: https://www.head-fi.org/threads/beyerdynamic-xelento.827372/page-78#post-14480482). My recommendation with silicone tips is always to anchor the IEM with mounting putty or blu-tack, while being careful not to block any vent ports on the IEM.
Unless you're on a near-lethal dose of Xanax, holding the IEM steady in the coupler with your hands while measuring won't work at all - you'll see all sorts of nasty artifacts in the measurements. Silicone-tipped IEMs must be anchored with mounting putty and then left well alone while measuring. For example, the Zero Audio Carbo Tenore is a tiny IEM which is held easily in the coupler by its own eartip:
But since that's a silicone eartip, it's time for mounting putty, being careful not to block the vent port:
For any odd-shaped eartips, mounting putty is also essential, because cylindrical or conical couplers need round eartips in order to form a proper seal.
Most of my measurements have been made with various SpinFit tips, because that's what I use most of the time and they're round and fit easily in my ears and my couplers. Foam would be an easier option for measurements, but unless I need maximum isolation, I tend to prefer the sound from Cp240, Cp800 or Cp100 SpinFits and so measurements with those specific eartips are more useful to me. This is why I used SpinFit Cp100 tips on the measurements in my review of the Xelento (https://www.head-fi.org/showcase/be...ile-devices.22337/reviews?order=likes#reviews).
So the choice of eartip and the method you use to create a seal for them are crucial. Always report what eartip was used when making a measurement, because FR differences between eartips will likely be significant.
6) Use a consistent (medium) sound-pressure level for all measurements: With headphones driven at very low volume levels, there's a greater risk of pollution from external noise or increased THD+N from the extra gain needed in the microphone pre-amp; at very large SPLs, there's a small risk of shifting the FR. While the frequency response of most headphones isn't all that sensitive to modest changes in SPL, many show small deviations at large dB levels and some show significant variations:
Xelento - Identical FR at all SPLs:
ER4XR - some small variations at larger SPLs:
SE846 - modest variations at larger SPLs:
KSE1500 - significant shifts in FR at larger SPLs:
I don't know whether the KSE1500 FR variation with SPL is another happy accident or intentional design. (Arguably, there's less need for U- or V-shaped sound signatures at very high volumes.) This doesn't affect me in practice, since I never listen to the KSE1500 above about volume level 13 - not even for very special occasions like Symphony X's "The Odyssey"
But for those that like to push the envelope and risk their hearing, there's a chance you're damping that treble peak as you raise the volume. Not necessarily a problem, IMHO, just a curiosity of this IEM. For those without a SPL meter, if you set the KSE1500 line-in to maximum green, these are the FR variations with volume level:
These last measurements were made with a (corrected/compensated) Vibro Veritas coupler and StarTech sound card, but they perfectly match the effect seen with the RME ADI-2 Pro/Focusrite Forte and 711 couplers.
So, to ensure consistent, repeatable measurements, there appears to be sweet spot in a range of roughly 85-95 dB, within which we can minimize measurement errors and still have a frequency response that doesn't visibly shift.
7) Use a source with a very low output-impedance. I've recommended devices like the Focusrite Forte here as an input device. You do not want to use the Forte as an output device to drive your headphones. This post explains why: https://www.head-fi.org/threads/audio-measurements-on-a-headfi-budget.893084/page-2#post-14956334
Just when you thought it was safe to publish your entire collection of headphone measurements, along comes a new "standard" that makes all your previous work obsolete. The latest in-ear simulator product from GRAS is what they're calling a "hi-res" coupler:
https://www.gras.dk/files/786-2710_low_gras1810High Res Ear Simulator for Headphone Testing_04.pdf
http://www.gras.us/files/783-High-Resolution-Ear-Simulator.pdf
The claim is that this new high-resolution coupler makes measurements up to 20 kHz more reliable. This new coupler adds a very strong damping to the ear canal's 1/2-wave resonance, the effect of which is to smear out any resonance peaks. From a headphone OEM marketing perspective (probably a large target market for this new in-ear simulator), this might be an attractive proposition. Your headphone measurements will look smoother, with less outrageous resonance peaks and they will exhibit lower total harmonic distortion (THD). But is it real? I had some communications with Morten Wille (GRAS) about this and here are his comments (which he asked me to reproduce in their entirety):
So GRAS' intention seems to have been focusing on the DUT and not ear canal resonances. That sounds fair, but appears to assume the effects of the two can't be non-linearly coupled. Personally, if there's a resonance there due to my ear canals which is exacerbated by a particular headphone, I'd want to know it exists. There should be an implicit understanding that the resonant frequency (and amplitude) would vary with ear canal geometry - i.e., from individual to individual. I also think the name "high-resolution" is a little misleading, as the resolution of the response at higher frequencies is actually smeared.
Despite the claim of "backwards compatibility up to 10 kHz", results below 10 kHz can be very different with the GRAS hi-res coupler. From a very limited number of tests I've done, it seems it's possible to make results from an existing 711 coupler match fairly closely to this new "hi-res" coupler by simply inserting a few pieces of acoustic damping foam into the coupler. However, I have not yet seen any evidence that this strong 1/2 wave damping is real and I'm not convinced that smearing over the details of these resonance peaks is a step forward. I don't consider measurements that are more repeatable and more invariant with insertion depth to be an improvement if that's not what happens in reality. I may change my opinion if new data surfaces in the future, but this is my current logic for not attempting any kind of hardware mod or compensation-curve correction to mimic GRAS' new hi-res coupler.
https://www.gras.dk/files/786-2710_low_gras1810High Res Ear Simulator for Headphone Testing_04.pdf
http://www.gras.us/files/783-High-Resolution-Ear-Simulator.pdf
The claim is that this new high-resolution coupler makes measurements up to 20 kHz more reliable. This new coupler adds a very strong damping to the ear canal's 1/2-wave resonance, the effect of which is to smear out any resonance peaks. From a headphone OEM marketing perspective (probably a large target market for this new in-ear simulator), this might be an attractive proposition. Your headphone measurements will look smoother, with less outrageous resonance peaks and they will exhibit lower total harmonic distortion (THD). But is it real? I had some communications with Morten Wille (GRAS) about this and here are his comments (which he asked me to reproduce in their entirety):
When discussing the response of human ears at high frequencies, things get complicated. There are big differences from person to person in the geometry of the ear canal that affect resonances and impedance. During the development process of the new ear simulator I looked at papers describing the transfer impedance of real ears. However, I did not find any hard data for high frequencies (10 kHz+). The original 711 Ear Simulator is based on measurements of the input impedance of real ears and the transfer impedance was derived from this data with some simplifications (e.g. The ear canal is considered a simple cylinder with at hard termination). The input impedance of the 711 ear simulator is actually very close to a real human ear, or perhaps more accurately, it is very close to A human ear. Meaning you can find someone with an ear exactly like the ear simulator.
For the high resolution Ear Simulator the goal of the project was to help users gain better and more repeatable measurements at frequencies above 10 kHz by damping the 1/2 wave resonance of the ear simulator. In my opinion, the ear simulator is not necessarily a better (or worse) representation of the human ear, but it will help you understand the high frequency response of your DUT in a better and easier way.
So GRAS' intention seems to have been focusing on the DUT and not ear canal resonances. That sounds fair, but appears to assume the effects of the two can't be non-linearly coupled. Personally, if there's a resonance there due to my ear canals which is exacerbated by a particular headphone, I'd want to know it exists. There should be an implicit understanding that the resonant frequency (and amplitude) would vary with ear canal geometry - i.e., from individual to individual. I also think the name "high-resolution" is a little misleading, as the resolution of the response at higher frequencies is actually smeared.
Despite the claim of "backwards compatibility up to 10 kHz", results below 10 kHz can be very different with the GRAS hi-res coupler. From a very limited number of tests I've done, it seems it's possible to make results from an existing 711 coupler match fairly closely to this new "hi-res" coupler by simply inserting a few pieces of acoustic damping foam into the coupler. However, I have not yet seen any evidence that this strong 1/2 wave damping is real and I'm not convinced that smearing over the details of these resonance peaks is a step forward. I don't consider measurements that are more repeatable and more invariant with insertion depth to be an improvement if that's not what happens in reality. I may change my opinion if new data surfaces in the future, but this is my current logic for not attempting any kind of hardware mod or compensation-curve correction to mimic GRAS' new hi-res coupler.
Things get a bit more interesting when trying to measure distortion and noise. I don't yet know of a way of producing THD measurements from a smartphone, but REW has the ability to measure the noise floor prior to its log f sweep, and from the frequency sweep phase data, the ability to pick up the lagged harmonic components which can be plotted for each harmonic, or summed to a total, up to a maximum of the 9th harmonic. REW also has an option to make "stepped sine" measurements for THD or THD+N which is much more time consuming, as it requires multiple individual sine-wave measurements, but also much more accurate. (Note that the smoother appearance of the stepped-sine results below is due to the use of only 3 points per octave.) This is the same headphone (Xelento) measured by both approaches using a 711 coupler and condenser mic, plotted with THD normalized with respect to the fundamental:

The main challenges with THD(+N) measurements are sources free of outside noise and vibration pollution or interference and an accuracy of the measuring equipment (mics, pre-amps, ADCs) that are of higher accuracy than the DUT. While the cheaper mics and couplers can be used for THD+N measurements, they tend to end up measuring their own distortions, rather than those of the headphones. Output formats are debatable here too, with some preferring to normalize with respect to the relevant harmonic, rather than the fundamental. In either case, absolute values of THD will be amplified by resonance peaks in the FR.
My current best recommendation for THD+N measurements is the RME ADI-2 Pro or Focusrite Forte fed with a condenser-mic 711 coupler using REW's stepped sine method. Here are examples of the condenser mic in a 711 coupler, vs dynamic mic in a 711 coupler and Vibro Veritas coupler with its own dynamic mic. All measurements were made with the stepped sine approach at 80 dB with 3 points per octave:

Note that there's no convergence here, i.e., all three mic/coupler/sound-card combos produce different levels of THD (and noise floor - not shown), and there's no indication we've reached a level where the absolute levels are now to be trusted. As such, please regard this as a work in progress. It is also very important to report the SPL (in dB) used for any THD measurements, as non-linear effects from the drivers become more prominent at larger excursions, i.e., louder volumes. I've chosen to perform all my THD measurements at one single level of 80 dB.
The main challenges with THD(+N) measurements are sources free of outside noise and vibration pollution or interference and an accuracy of the measuring equipment (mics, pre-amps, ADCs) that are of higher accuracy than the DUT. While the cheaper mics and couplers can be used for THD+N measurements, they tend to end up measuring their own distortions, rather than those of the headphones. Output formats are debatable here too, with some preferring to normalize with respect to the relevant harmonic, rather than the fundamental. In either case, absolute values of THD will be amplified by resonance peaks in the FR.
My current best recommendation for THD+N measurements is the RME ADI-2 Pro or Focusrite Forte fed with a condenser-mic 711 coupler using REW's stepped sine method. Here are examples of the condenser mic in a 711 coupler, vs dynamic mic in a 711 coupler and Vibro Veritas coupler with its own dynamic mic. All measurements were made with the stepped sine approach at 80 dB with 3 points per octave:
Note that there's no convergence here, i.e., all three mic/coupler/sound-card combos produce different levels of THD (and noise floor - not shown), and there's no indication we've reached a level where the absolute levels are now to be trusted. As such, please regard this as a work in progress. It is also very important to report the SPL (in dB) used for any THD measurements, as non-linear effects from the drivers become more prominent at larger excursions, i.e., louder volumes. I've chosen to perform all my THD measurements at one single level of 80 dB.
Noise (N) and/or THD+N are attributes that, IMHO, most manufacturers simply don't provide sufficient (or any?) relevant information on. THD or total harmonic distortion represents the sum of all harmonics that are triggered by the fundamental; N, or noise, typically just refers to everything else. So, N could include noise floor (which might rise or modulate with gain), intermodulation distortion, electromagnetic interference, the dog barking nearby, etc. N is often represented in terms of a signal to noise ratio or SNR, which is a number that can be used to mislead. For example, it might not be all that relevant that your system can reach 150 dB SPL if you listen at much quieter levels - and at those quieter levels you're bothered by a noise floor. Also, SNR is usually defined via an A-weighting (dBA) measure which is designed to mimic human hearing - i.e., to roll off substantially at the frequency extremes (lows and highs). That's, arguably, kind of cheating - because it means any distortion or noise components lower or higher than 1 kHz (in other words, everywhere) are going to be damped, regardless of the fundamental. Of course, this leads to better-looking specs though Also, it's very common to only report results from a single sinusoid (typically, 1 kHz), and often without any mention of the voltage or SPLs involved. This doesn't tell you what sort of N you'd perceive in real music - not even if your favored genre were Concerto at 1 kHz, or Rhapsody in 10 minutes of B5.
N might be exacerbated by the headphone (sensitive IEMs are more susceptible to hissing), but none of the sources of N can usually be attributed to a fault of the headphone or IEM itself. For an IEM, the relevant parameter is usually just the THD. For electronic equipment, measuring N or SNR is challenging because the measurement equipment needs to be better than that of the DUT and one really needs to take into account the effect of A-weighting. An extract from AES17-2015:
REW doesn't currently support this, but A-weighted dynamic range measurements are coming in a future release. Stay tuned ...
Also, it's very common to only report results from a single sinusoid (typically, 1 kHz), and often without any mention of the voltage or SPLs involved. This doesn't tell you what sort of N you'd perceive in real music - not even if your favored genre were Concerto at 1 kHz, or Rhapsody in 10 minutes of B5.N might be exacerbated by the headphone (sensitive IEMs are more susceptible to hissing), but none of the sources of N can usually be attributed to a fault of the headphone or IEM itself. For an IEM, the relevant parameter is usually just the THD. For electronic equipment, measuring N or SNR is challenging because the measurement equipment needs to be better than that of the DUT and one really needs to take into account the effect of A-weighting. An extract from AES17-2015:
6.4.1 Dynamic range
This test measures the ratio of the full-scale level at the output of the EUT to the weighted noise and distortion level in the presence of a low-level signal. It includes all harmonic, inharmonic, and noise components.
NOTE This characteristic is also known as signal-to-noise ratio.
The test signal shall be a 997 Hz sine wave with a level of -60 dB relative to the maximum input level (see 6.2.1). The output of the EUT shall be filtered with the standard low-pass filter (see 5.2.5) and the standard notch filter (see 5.2.8), whose center frequency is set to 997 Hz. The output of the standard notch filter shall be filtered with the standard weighting filter (see 5.2.7). The rms level of the final filter output shall be measured.
The dynamic range shall be the ratio of the maximum output level (see 6.2.6) to this measured level
REW doesn't currently support this, but A-weighted dynamic range measurements are coming in a future release. Stay tuned ...
Another very cool and useful thing you can do with REW is to take measurements of headphone impedance versus frequency. To do this, you need a special cable that forms a circuit like this:

In my cable, the right channel of a 3.5 mm in-line TRS headphone socket is wired to the soundcard inputs and source output with the input positives bridged by R1, a nominally 100 Ohm (non-inductive) TFT resistor. I left the solder contacts open so that it can easily be measured or shorted to calibrate within REW:

You need a good-tolerance resistor, but if you have a digital multimeter, that's even better. In my case, R1 was actually 100.2 Ohm, and the silver litz cable and connectors added another 0.2 Ohm. You can enter the resistance with this level of precision within the calibration setup for impedance measurements in REW.
You don't need a coupler for impedance measurements - the headphone or IEM simply needs to be connected. What REW then does during its log frequency sweep is to compare the voltage difference between the left and right channels on the input sound card. The current flowing into the load will be (V_left - V_right)/R1 and since the voltage across the load is V_right, REW can determine the impedance from Ohm's law as voltage/current = R1*V_right/(V_left - V_right).
Some examples:


In my cable, the right channel of a 3.5 mm in-line TRS headphone socket is wired to the soundcard inputs and source output with the input positives bridged by R1, a nominally 100 Ohm (non-inductive) TFT resistor. I left the solder contacts open so that it can easily be measured or shorted to calibrate within REW:
You need a good-tolerance resistor, but if you have a digital multimeter, that's even better. In my case, R1 was actually 100.2 Ohm, and the silver litz cable and connectors added another 0.2 Ohm. You can enter the resistance with this level of precision within the calibration setup for impedance measurements in REW.
You don't need a coupler for impedance measurements - the headphone or IEM simply needs to be connected. What REW then does during its log frequency sweep is to compare the voltage difference between the left and right channels on the input sound card. The current flowing into the load will be (V_left - V_right)/R1 and since the voltage across the load is V_right, REW can determine the impedance from Ohm's law as voltage/current = R1*V_right/(V_left - V_right).
Some examples:
A Few of My Favorite Things
I don't have the time, the energy or the will to create the sort of enormous database that @crinacle has put together on headfi, but I wanted to include a few plots here of a select number of headphones that I think are worthy of consideration. A kind of mini wall of fame, if you like
These are all great headphones - I'm not sure there's a right or wrong with respect to frequency responses here, as it just comes down to individual hearing and preferences.
Stepped-sine THD measurements were again made at 80 dB SPL with 3 points per octave (output normalized w.r.t. the fundamental):
Surprisingly, the Xelento measures with the lowest THD of any of these IEMs - lower even than that of the KSE1500. The consistent rise in THD at lower volumes with all IEMs may be because I tend to like eartips that provide a very good seal - sometimes better than that intended by the OEM (I like my sub-bass!) At some point I will revisit this measurement rig to make sure it's adequately damped from vibrations.
This one may stoke some controversy, because obviously earbuds aren't sealed in the ear canal and so their response will depend to some extent on the outer ear too. But there's an even bigger problem with earbuds, which is the enormous shift you can get in low-frequency response by adjusting the tiny gap between ear and earbud - even marginally. This can be impacted by geometry of the tragus and antitragus, and even the thickness of the foam used (if any). This makes measuring earbuds really challenging. I built myself a temporary outer ear from moulding putty around the coupler and simply ensured that each bud was lying completely flat against the opening. Measurements like this are still *mostly* repeatable

I'm relatively new to the TOTL earbud scene, but have been blown away by the sound quality of some of these earbuds. If your last experience with earbuds was an Apple earbud/pod, etc., you owe it to yourself to take another look at where things are now. Obviously, earbuds don't isolate, but sometimes that's a good thing because you might want to be aware of your surroundings. Sub-bass isn't quite there with any of these earbuds, but otherwise some of these newer earbuds are very impressive. I find some of the best earbuds (my personal favorites are the Shozy Bk buds) give a soundstage, frequency response, and overall listening experience which is amazingly close to that of my Sennheiser HD800s.
I'm relatively new to the TOTL earbud scene, but have been blown away by the sound quality of some of these earbuds. If your last experience with earbuds was an Apple earbud/pod, etc., you owe it to yourself to take another look at where things are now. Obviously, earbuds don't isolate, but sometimes that's a good thing because you might want to be aware of your surroundings. Sub-bass isn't quite there with any of these earbuds, but otherwise some of these newer earbuds are very impressive. I find some of the best earbuds (my personal favorites are the Shozy Bk buds) give a soundstage, frequency response, and overall listening experience which is amazingly close to that of my Sennheiser HD800s.
Parting Thoughts
As I said at the top, this is a journey. I hope this is helpful for those starting out with their own measurements. Criticisms, suggestions, flame wars, etc., are all welcome - especially with alternative or improved suggestions on hardware, software or measuring techniques. I will try to update this post if I get any further information on good hardware or software options down the road.
Last edited:
 I'm glad you didn't end up destroying stuff just to get worst results. it was positive for me but the bar was set so low with my other cheapo toys that I really wasn't sure if it was something to even suggest doing.
  . so that specific hobby sort of fueled itself in my case. each answer leading to more new questions I didn't even know were a thing before answering the previous ones. and in some overly complicated way, I'm still sort of trying to answer my very first question. or at least trying to come closer and closer to some ideal answer(that might be changing as I age).


 . so I'm wondering if you're showing legit non linearity for some drivers, caused by airflow limitations or whatever. or if maybe you're actually going too loud for some drivers that can't physically move as much as the amplitude requires?, or measuring ambient noise at some point. could it be the mic that's not showing the same FR at different outputs?