A proposed optical digital cable test
Apr 1, 2010 at 9:54 PM Post #91 of 138
oh ok, in "high precision" mode the USD01 could help indeed
smily_headphones1.gif
 
Apr 2, 2010 at 2:00 AM Post #93 of 138
I can't tell them apart at all.


USG

Edit: to ask who else is going to weigh in on this?

Equip used: laptop, foobar 9.6.8, blue circle thingee (USB to Coaxial), North Star MKII, M^3/sigma PS, '03 880s
 
Apr 2, 2010 at 2:59 AM Post #95 of 138
Quote:

Originally Posted by leeperry /img/forum/go_quote.gif
A sounds noticeably clearer to me, B sounds mushy, and C sounds jitter'ed up
biggrin.gif


What equipment were you using for your evaluation Lee?

USG
 
Apr 2, 2010 at 3:01 AM Post #96 of 138
a CMI8768 board using Dogbert's drivers on XP SP3 to my Firestone Spitfire fed w/ glass toslink, using uLilith in ASIO...I can clearly hear differences between the 3 files, but I dunno which one is the original, I just know that I don't like how B sounds...at all.

the second sound seems too late in B and the last sound seems colored in C, and the first sound is much clearer in A...ah well, maybe I'm just imagining things
tongue.gif
 
Apr 2, 2010 at 3:14 AM Post #97 of 138
Quote:

Originally Posted by leeperry /img/forum/go_quote.gif
a CMI8768 board using Dogbert's drivers on XP SP3 to my Firestone Spitfire fed w/ glass toslink, using uLilith in ASIO...I can clearly hear differences between the 3 files, but I dunno which one is the original, I just know that I don't like how B sounds...at all.

the second sound seems too late in B and the last sound seems colored in C, and the first sound is much clearer in A...ah well, maybe I'm just imagining things
tongue.gif


What type of C-media transport are you using?

What headphones?

Where can I get the player you're using?

USG

Edit to ask what amp you are using?

I thought of another question: how loud were you evaluating?
 
Apr 2, 2010 at 11:52 AM Post #98 of 138
Quote:

Originally Posted by upstateguy /img/forum/go_quote.gif
What type of C-media transport are you using?
What headphones?
Where can I get the player you're using?
what amp you are using?
how loud were you evaluating?


-a CMI8768 PCI board using those drivers: http://code.google.com/p/cmediadrivers/
-Sony cd1k(same drivers as the cd3k)
- http://www.project9k.jp/download/uLilith/
-my amp is in the mail, I currently use an impedance adapter + 64bit float digital attenuation in uLilith
-not loud at all

I also EQ down middle ear resonances to get an as flat as possible FR: http://www.head-fi.org/forums/6508490-post409.html

so nickcharles? care to share the results please? in PM possibly?
 
Apr 2, 2010 at 4:09 PM Post #99 of 138
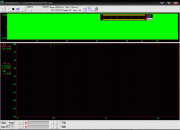
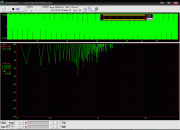
I took the reference file and inverted it. Then I added it to the CD recording. This shows the waveform differences as below. The second graphic shows the frequeny component of the difference file and the magnitude, this is much better than Audacity as a visualization. This is using the highest FFT available. A scope of a wav file digital silence shows a completely blank graph with all frequencies at - 268db. Next step then record digital silence and see what random noise there is...

10951065-be9.jpg


The difference between the reference and the recording as shown by a 64K FFT

10951064-e03.jpg


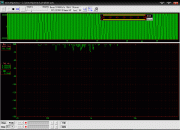
Digital Silence recorded, i.e here is the background noise of the system : Average = -144.2db, worst noise peak -125.6db
------------------------------------------------------------------------------------------------------------------

10951644-6b7.jpg
 
Apr 2, 2010 at 4:25 PM Post #100 of 138
ah well, the human brain is a poor measuring tool anyway
hiddensmile.gif


but maybe those slight FR differences are changing the DAC built-in oversampling/post-filtering behavior or whatever.

I can easily reproduce the differences I said I heard between A/B/C...A is brighter and C sounds a bit funky.
 
Apr 2, 2010 at 6:29 PM Post #101 of 138
Armed with what seems a better analytical tool I did a comparison between a recording and the reference and this time just calculated the differences at each freq and the sorted them the biggest deviations are thus:

10951983-ed1.jpg


and

10951996-9da.jpg


So the biggest differences happen at low levels , so what are the differences at higher levels, time to sort on descending levls. The peak frequency is about 3147 and the level is ~ -28db, here the difference is 0.000071db
it stays below 0.01db until we get routrinely below -80db so the deviations are highly correated to the signal level.

10952237-41a.jpg
 
Apr 2, 2010 at 6:44 PM Post #102 of 138
Quote:

Originally Posted by nick_charles /img/forum/go_quote.gif
Armed with what seems a better analytical tool I did a comparison between a recording and the reference and this time just calculated the differences at each freq and the sorted them the biggest deviations are thus:

[http://www.divshare.com/img/10951983-ed1.jpg


and

http://www.divshare.com/img/10951996-9da.jpg


Hi Nick

Would you care to explain what this means to the general population?
bigsmile_face.gif


USG
 
Apr 2, 2010 at 8:03 PM Post #103 of 138
-0.49dB at 20kHz is still a hell lot for a "bit-perfect" loopback IMHO...and it would definitely change the DAC post-filtering behavior I think.

how about generating a 20.5kHz sinetone(w/ SineGen?), and measure it through WaveSpectra w/ 130K samples FFT? there's a hell lot of window functions too.

some test I previously ran on Reclock(a tool that resamples movies audio to exactly match the video refresh rate):
Quote:


THD/THD+N/SNR
original: 0%/0.00214%/214.22
47952kHz: 0.0003%/0.00306%/195.07
95904kHz: 0.0002%/0.00293%/143.31
191808kHz: 0.004%/0.00297%/141.16


but depending on the window function and the FFT size, the results will very much differ...so good luck finding the "right" ones...as it's dead easy to manipulate the data to look the way you want them to
evil_smiley.gif
 
Apr 2, 2010 at 8:36 PM Post #104 of 138
Quote:

Originally Posted by upstateguy /img/forum/go_quote.gif
Hi Nick

Would you care to explain what this means to the general population?
bigsmile_face.gif


USG


Okay, a digital recording using this system is more accurate in terms of amplitude for frequencies where the input signal level is higher. So for the dominant frequencies which are about 3Khz in this example ( a set of cymbal crashes) the input signal levels are about -28db and the recording shows miniscule deviations from this (0.000071db). As the input signal level decreases the recording becomes (relatively) less accurate. So for frequencies with less energy the recording is less accurate.

The practical upshot is that until the signal level drops below -73db the recording is pretty accurate in terms of amplitude (never deviating by more than 0.01db and rarely that much) , but as the level drops more variation creeps in so that for frequencies with a signal level of less than -108db the recording deviates by up to 0.4db.

But, there are only 12 frequency points at which the difference between input and recording exceeds 0.1db and this is out of 32768 samples and only 43 where it exceeds 0.05db and all of these happen for frequencies with an amplitude of less than -88db . For only 2% of all frequencies tested does the deviation reach 0.01db.
 
Apr 2, 2010 at 9:04 PM Post #105 of 138
Quote:

Originally Posted by leeperry /img/forum/go_quote.gif
-0.49dB at 20kHz is still a hell lot for a "bit-perfect" loopback IMHO...


Agreed, it is clearly not bit-perfect, but interestingly for this sample the deviation is not correlated with frequency it is the level of the frequency, as the level goes down the accuracy decreases, so although the -0.49 db point occurs when the reference signal is at -108db which is at 20K its the -108db that is key not the 20K as there are poor showings at 3K, 1K, 2K and 300hz and 100hz and when I plotted deviation vs frequency there was no significant relationship. When I tested analog recordings with the same device there was a very clear relationship between frequency and error.


Quote:

but depending on the window function and the FFT size, the results will very much differ...so good luck finding the "right" ones...as it's dead easy to manipulate the data to look the way you want them to
evil_smiley.gif


Sure, I just used the biggest FFT setting in CEP as it showed the highest accuracy with a 1K test tone and the B-H type had the narrowest spectra.

130K samples I can try but the data files will be a bit unmanageable, I can barely deal with the 64K files in Excel and cannot chart them properly.

Okay, I tried Wavespectra and Sinegen. Wave spectra is fun but it does not seem to export the results, I am also not quite sure I can interpret the results as it showed a THD+N of 700% ?? Does not seem to help for what I want to do, but thanks anyway fun to play with
 

Users who are viewing this thread

Back
Top